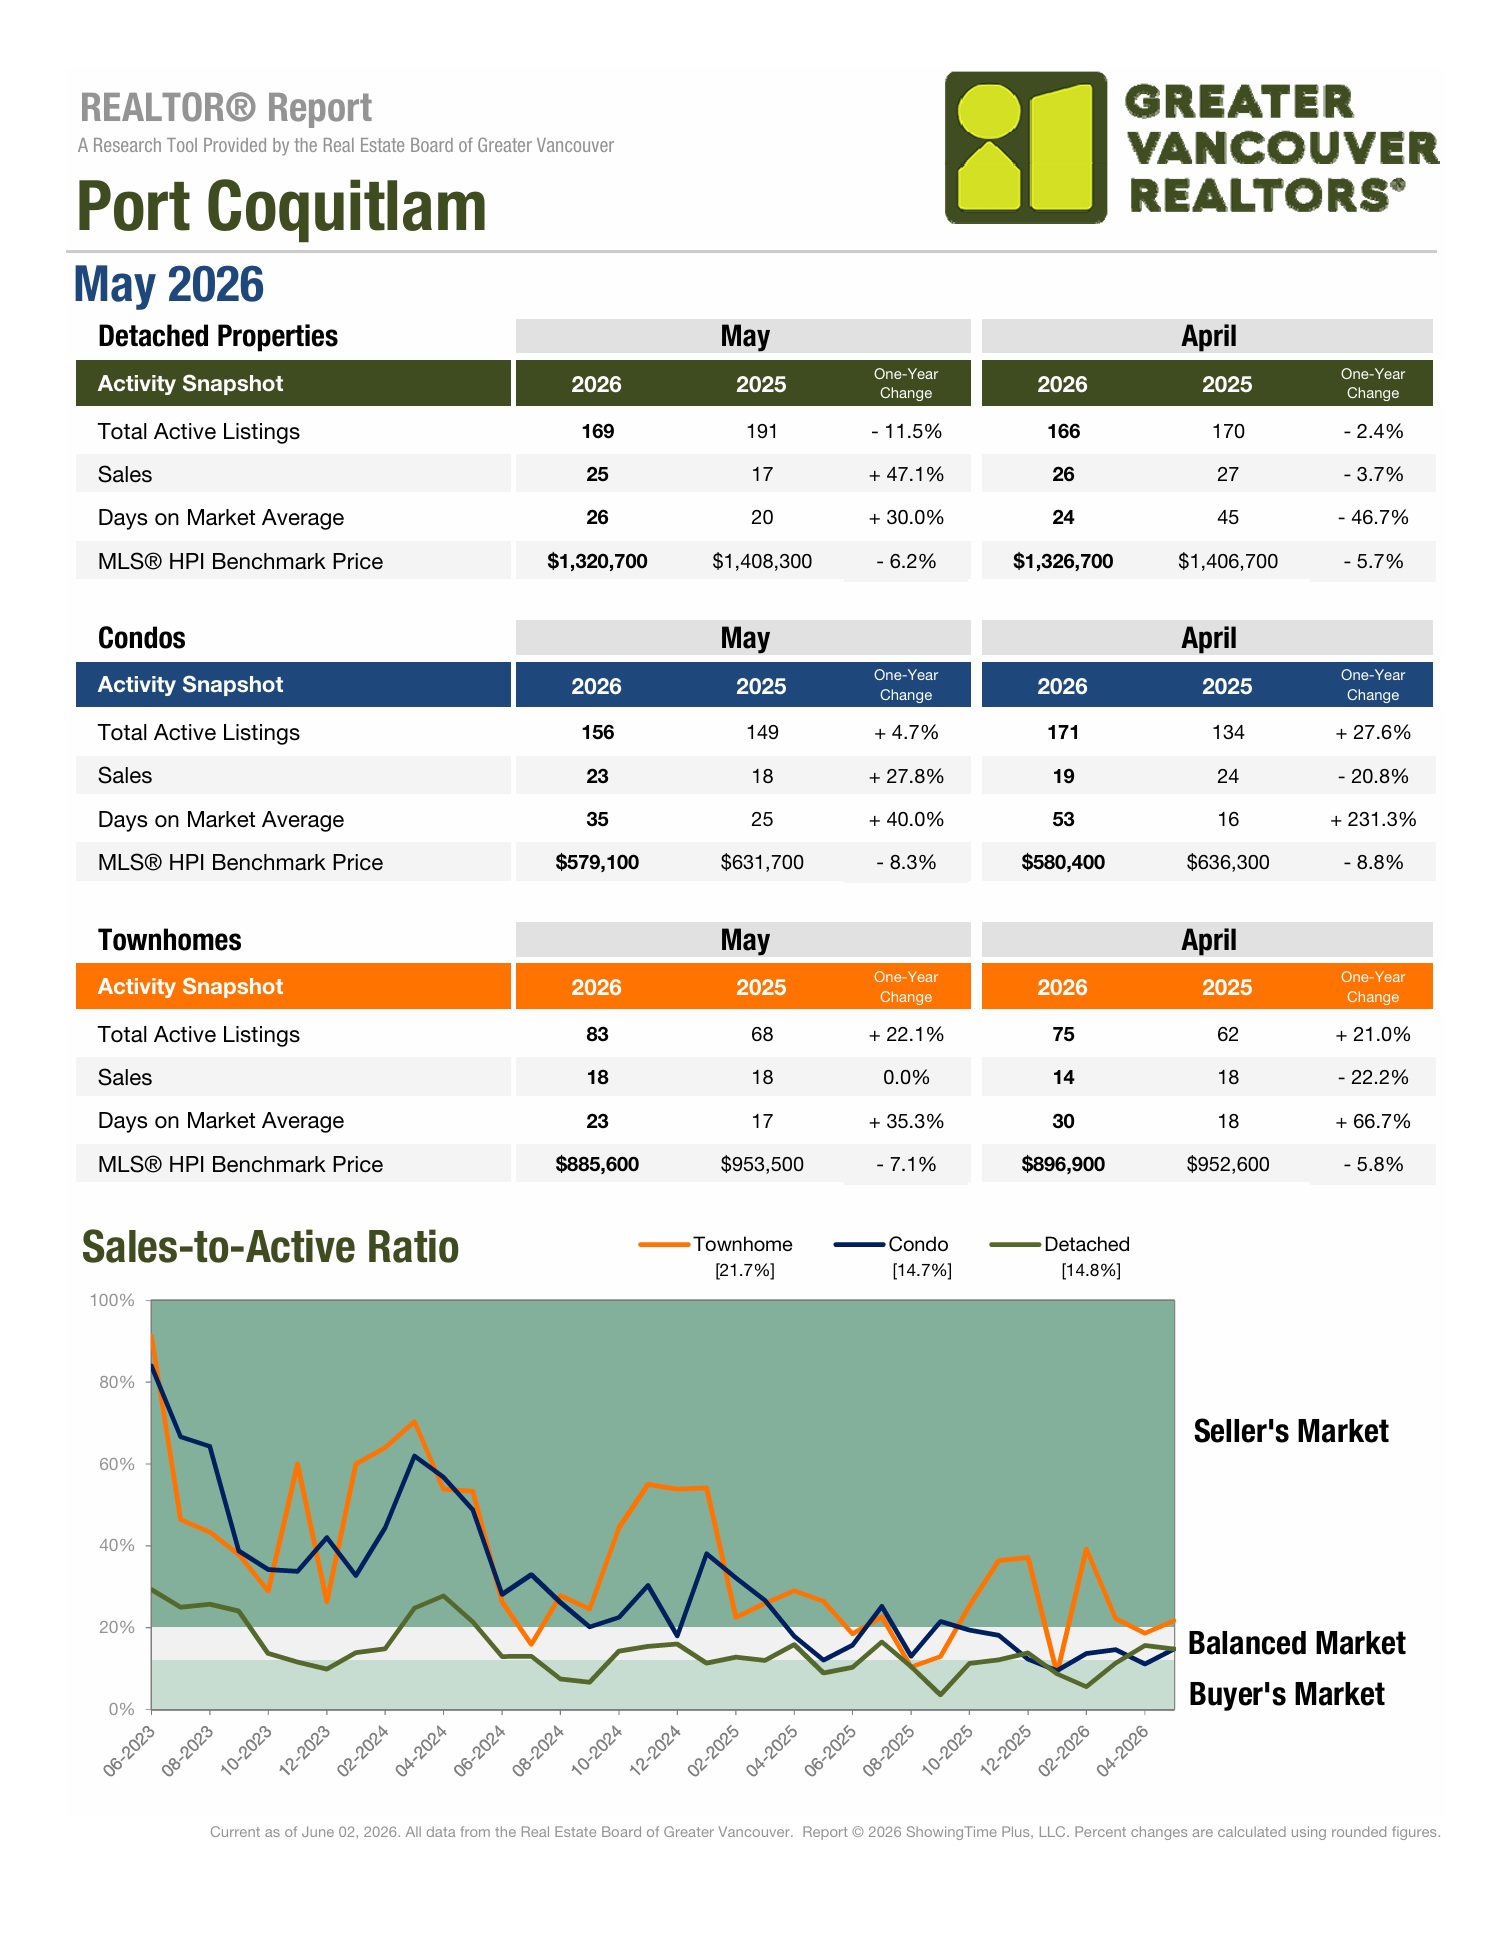
Port Coquitlam Market:
May 2026 vs 2025

Prices continue to soften
Supply & sales increase for 2/3 of the market.
Looking for an accurate picture of where the real estate market is headed?
Today we dive in and take a deeper look at the Port Coquitlam market as a whole:
- A full overview & an in depth look at detached homes, townhouses, & condos focusing on:
- How statistics stack up to the previous month’s activity.
- Where we are standing compared to the same time period in 2024.
- Larger market trends.

•••
Port Coquitlam Benchmark Price Overview:
- Townhouse: After five months of sub-900k benchmarks, March broke the streak with a 38k+ increase. 60-days later & those gains are nearly 50% gone as the market continues to balance out March’s over-correcting jump-up.
- Detached: While February & March marked the first back-to-back monthly increases since May-June of last year the gains were short lived. April saw a steep 24k+ decline pushing the market back to March 2023 price levels. & that is where it remains planted after another 6k decline in May.
- Condo: The first 4-months of 2026 saw yo-yo pricing. January was up, February was down, March was up, and April is down. May breaks this pattern with a second month of decline..albeit an extremely minor one.
- The benchmark has been under 600k since October of last year. The last time it dipped below 600k was December 2022. And even then it was only sub 600k for a single month.
- The benchmark is now 9k below February 2022.
Port Coquitlam Market Snapshot (a review):
- Over the last six months the real estate market in Poco has developed as follows:
- This year a December slowdown really set in. We finished the year with falling prices, month over month sales declines and a supply reduction. Despite prices coming down and supply doing its best to get back to a manageable level the power is still in the hands of hesitant buyers who seem to be waiting for a bottom that has yet to crystalize.
- 2026 began with sales decreasing across the board as supply took massive step up for townhouses while remaining high for condos and detached homes. In January 2/3 of the market saw a price dip while condos saw a slight leveling while remaining at a multi-year low.
- In February detached homes were the only facet of the market to see sales decrease further. Townhouses saw their sales quadruple. Active listing saw a positive reduction for attached listings while detached homes saw a large spike upwards.
- On the whole March was a strong month for the market and a potential first spring pop. Benchmark prices were up across all market segments and both detached homes and condos saw their sales increase and days on market reduce. However, supply has once again taken a step up for all housing styles.
- After a strong month the market has recoiled in April. Supply has spiked across the board as days on market increase. Sales remain relatively strong, but with supply mounting again it might not be enough before summer sets in and listings grow stale.
- May marks the second straight month of unanimous benchmark price decline. Supply is up everywhere aside from condos, sales remain relatively strong, & days on market improve aside from detached. The detached market, at least month-over-month, is putting forward the weakest performance.
Year-over-year Comparison:
- Year-over- year the detached market is split. On the positive side supply is down by 11.5% and sales have almost doubled. Negatively days on market have seen a 30% increase and the benchmark price is down $87,600.
- Ever metric for the townhouse market is showing regression or stagnation compared to 2025. Supply is up over 22% while days are market are up over 35%. Even with a $67,900 decrease to their benchmark price sales remain on par with May 2025.
- Aside from a year-over-year sales increase of 27.8% condos are not doing very well. Days on market have increased by 40% as active listings slowly creep up and the benchmark price is down $52,000 which is over 8% (the largest year-over-year decrease in the market).
Overall Supply & Sales Update:
Compared to the same time last year supply is mixed:
- Detached: -11.5%
- Condo: +4.7%
- Townhouse: +22.1%
Supply is mixed when May is compared to April:
- Detached: 3 more listings than in April
- Condo: 15 less listings than in April
- Townhouse: 8 more listings than in April
Compared to the same time last year sales are generally trending up:
- Detached: +47.1%
- Condo: +27.8%
- Townhouse: 0.0%
Sales are holding month over month (compared to April):
- Detached: 1 less sale than April
- Condo: 4 more sales than April
- Townhouse: 4 more sales than April

•••
Detached Market Update:
- May 2026 vs 2025 sees the detached benchmark price decrease by $87,600.
- Since October there have been seven months where the benchmark has been below April 2023.
- At this point it is safe to say the detached market is squarely at spring 2023 pricing.
- One of the market’s main issues has been high supply.
- 2026 has been plagued with increasing oversupply. May was the fourth straight month to see a supply increase.
- The one bright spot in the detached market is a sustained sales strength. Since March the number of sales for detached homes has remained strong.
- Last time the benchmark was this low there were only 66 active listings. Currently there are 103 more listings in May when compared to April 2023.
- Main question is will the benchmark have to dip further to sell through the oversupply?
- After hitting a benchmark high in March, April saw a new 2026 low. Unfortunately the downward momentum has continued with May setting another low-point for 2026. A new 37-month low.
Detached Home Benchmark Pricing:
- May: $1,412,000
- June: $1,382,900
- July: $1,359,500
- August: $1,356,600
- September: $1,361,800
- October: $1,349,400
- November: $1,358,700
- December: $1,343,000
- January: $1,340,100
- February: $1,347,000
- March: $1,351,300
- April: $1,326,700
- May: $1,320,700
•••
Townhouse Market Update:
- Since February brought some positivity to the townhouse market and March saw a huge benchmark increase…it hasn’t been overwhelming good news.
- April was a speed bump. Active listings increased along with days-on-market, while the benchmark decreased back below 900k.
- With May prices continued downwards and supply increased again, but, sales increased marginally and days on market took a step back. It is a mixed bag.
- The benchmark price is 7.1% below May 2025. A increase of 1.3% vs April 2026 vs 2025 and an increase of 2.3% vs March 2026 vs 2025.
- The year-over-year price decrease is widening.
- May 2026 is now $17,100 below the 2026 peak
- The current market situation could still be part of a much larger correction to re-balance prices prior to 2022’s all-time peak where the benchmark increased from a low of ~660k in 2021 to a high of over $1,031,000 in 2022.
Townhouse Benchmark Pricing:
- May: $956,300
- June: $949,600
- July: $945,200
- August: $917,900
- September: $913,800
- October: $884,300
- November: $893,500
- December: $882,800
- January: $870,000
- February: $864,500
- March: $902,700
- April: $896,900
- May: $885,600
•••
Condo Market Overview:
- Before taking a positive step forward in March, which set a benchmark high for 2026, six of the last nine months had marked new low points for the condo market.
- The benchmark price is now $18,100 below 2026 benchmark high.
- The benchmark has now decreased nine of the last 11 months.
- May’s benchmark is $52,600 lower than May 2025. A massive 8.3% dip.
- Between February & April supply increased by 58. Finally May sees a reprieve with 15 less listings than April.
- Sales have now increased three of the last four months.
- May is now the 9th straight month with a sub 600k benchmark.
- The last time the benchmark was below 600k for more than a single month was prior to it ever breaking 600k in the first place back in 2021. It has never dipped below 600k after surpassing it for this long before.
Summary:
Port Coquitlam’s market continued to soften in May, with benchmark prices declining across all three housing segments for the second straight month. Sales activity remains relatively strong, but buyers continue to hold the advantage as supply stays elevated and pricing pressure persists.
Detached homes remain the market’s weakest performer. The benchmark fell another $6,000 to $1,320,700, marking a new 37-month low and firmly returning the segment to spring 2023 pricing levels. Inventory increased for a fourth consecutive month, though sales have remained surprisingly strong.
Townhouses also moved lower, with the benchmark slipping to $885,600. Nearly half of March’s sharp rebound has now been erased as the market continues to rebalance. Supply increased again, while modest sales gains and improving days on market provided a small bright spot. Prices are now 7.1% below last year.
Condos remain under pressure. The benchmark declined for a second consecutive month and has now fallen in nine of the last eleven months. Prices sit more than 8% below May 2025, while the benchmark has remained below $600,000 for nine straight months. Sales continue to improve, but inventory remains elevated.
Overall, May showed little sign of a meaningful spring recovery. Sales have improved from last year, particularly for detached homes and condos, but declining prices and elevated supply continue to favour buyers heading into summer.
Our Google reviews will give you all the confidence you need!
TOP 5 reasons to work with R3 Hayes Real Estate Group

In a market full of noise and hesitation, we’re the steady hand you can trust.
Whether you’re planning ahead or ready to make a move, let’s talk strategy—we’re here to help you come out ahead.
![]()
R3 Hayes Real Estate Group – Your Neighbourhood Experts
Call/Text Ryan: 604-561-2127
Follow us on social media for more market updates!