GVR Market Review
Sales are up — Slowly declining prices — Fewer New Listings
Wondering what changed in Metro Vancouver’s real estate market last month?
June’s Snapshot
Ever since a busy October, the number of monthly sales in the Greater Vancouver area has generally been decreasing. January was exceptionally slow, and in that respect, February represented a step in the right direction. But now a larger question looms: is this the new normal? High inventory, hesitant buyers, and sales well below the 10-year average. Based on many analytics—and the majority of 2025—it increasingly appears that it may be.
Inventory remained elevated at 13,545 active listings, sitting 37% above historical norms. However, there were 2,848 fewer active listings in February compared to October 2025. From this perspective, historically high inventory relative to the 10-year average becomes somewhat less relevant, as listings have still declined significantly over the past four months and the immediacy of that figure is much more important.
Statistics tell a story, but it often depends on how you interpret them.
Traditionally, shrinking supply has shifted power toward sellers and led to rising prices. Currently, that isn’t happening. Prices continue to ebb and flow—minor decreases followed by minor increases. Supply remains too high to meaningfully influence pricing in a sustained way…in the historically expected way.
In many respects, the rules have been broken. The metrics that once acted as a guiding light for the market are no longer as reliable as they once were.
Below is a snapshot of the current reality for the Greater Vancouver market as a whole.
•••
Let’s break down the numbers and what they mean for you.
Market at a Glance
Sales Activity:
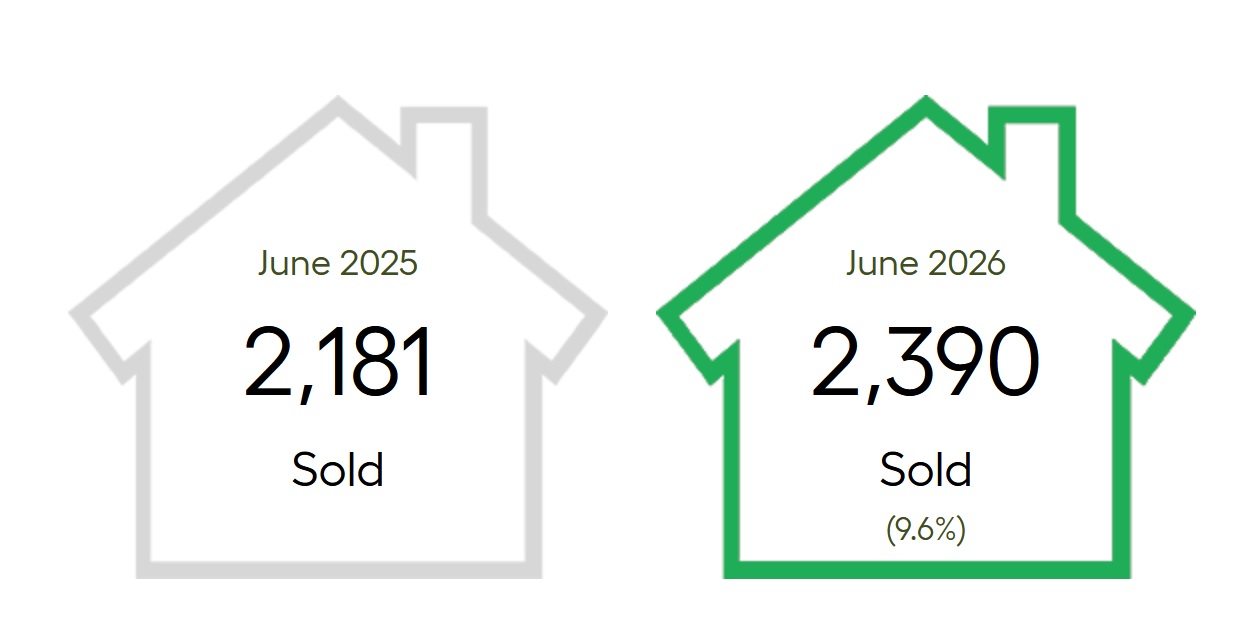
- 2,390 residential sales in June 2026
- 9.6% increase over June 2025
- 240 more sales compared to May 2026
- Highest monthly sales in over a year
- June sales were 12.4% below the 10-year average
New Listings:
- 5,938 properties listed in June 2026
- There were 177 less new listings in June when compared to May
- Down 6% from June 2025
- 5.9% more new listings than the 10-year seasonal average
Total Active Listings:
- 17,017 homes on the market
- Down 3.1% from June 2026
- There are 30.2% more listings than the 10-year average
MLS® HPI Composite Benchmark Price:
- $1,099,100
- Down 6% year-over-year
- Down 0.1% from May
After new listings spiked in April the rate has slowed for the past two months. However, supply remains historically high compared to the 10-year average & new listings during April through June remain elevated compared to the prior six months.
The number of monthly sales is the big success story for June. It was the most active month for Greater Vancouver in over a year. Up nearly 10% year over year with a sizable increase month over month. While this is all positive for sellers, even for all its gains June still sat 12.5% below the 10 year average.
Month-over-month prices continue to trend downwards between 0.2-0.5% for each segment of the market with year-over-year prices down between 5-7%.
•••
Sales-To Active Listing Ratio June 2026
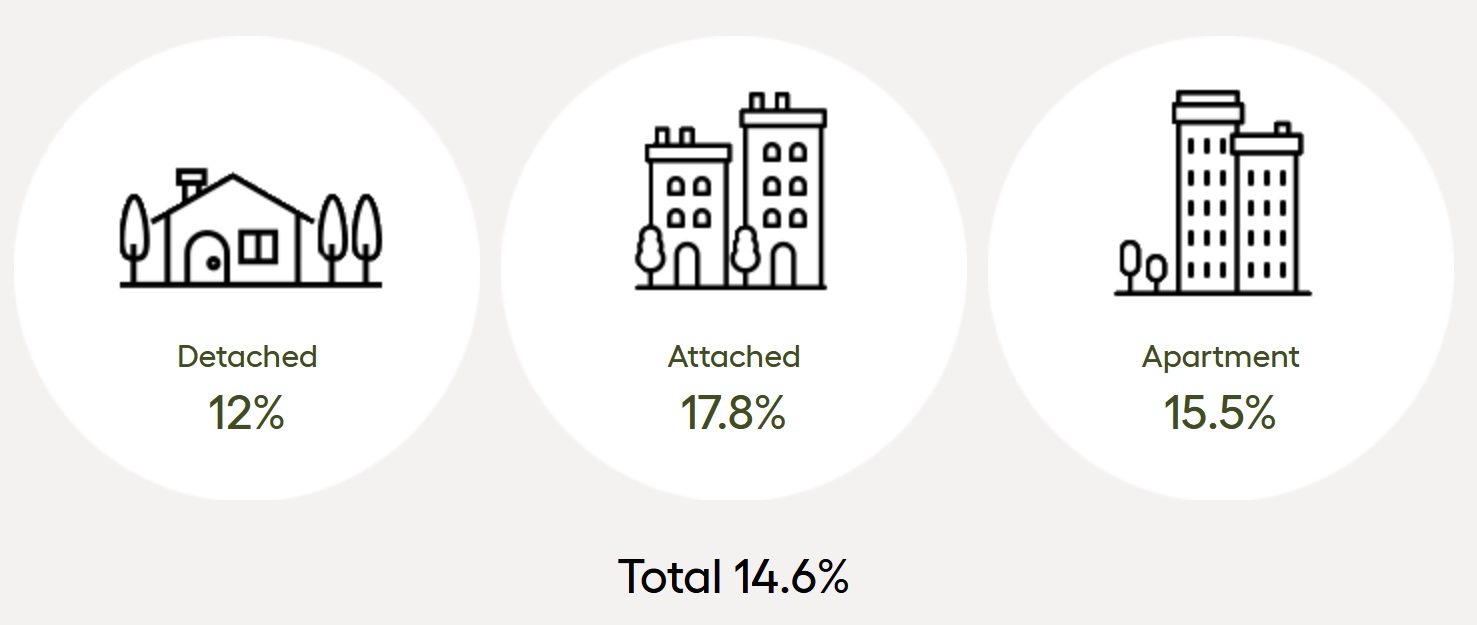
Data suggests downward pressure on home prices occurs when the ratio dips below 12 per cent for a sustained period, while home prices often experience upward pressure when it surpasses 20 per cent over several months.
•••
Breaking Down the Property Types
Detached Homes
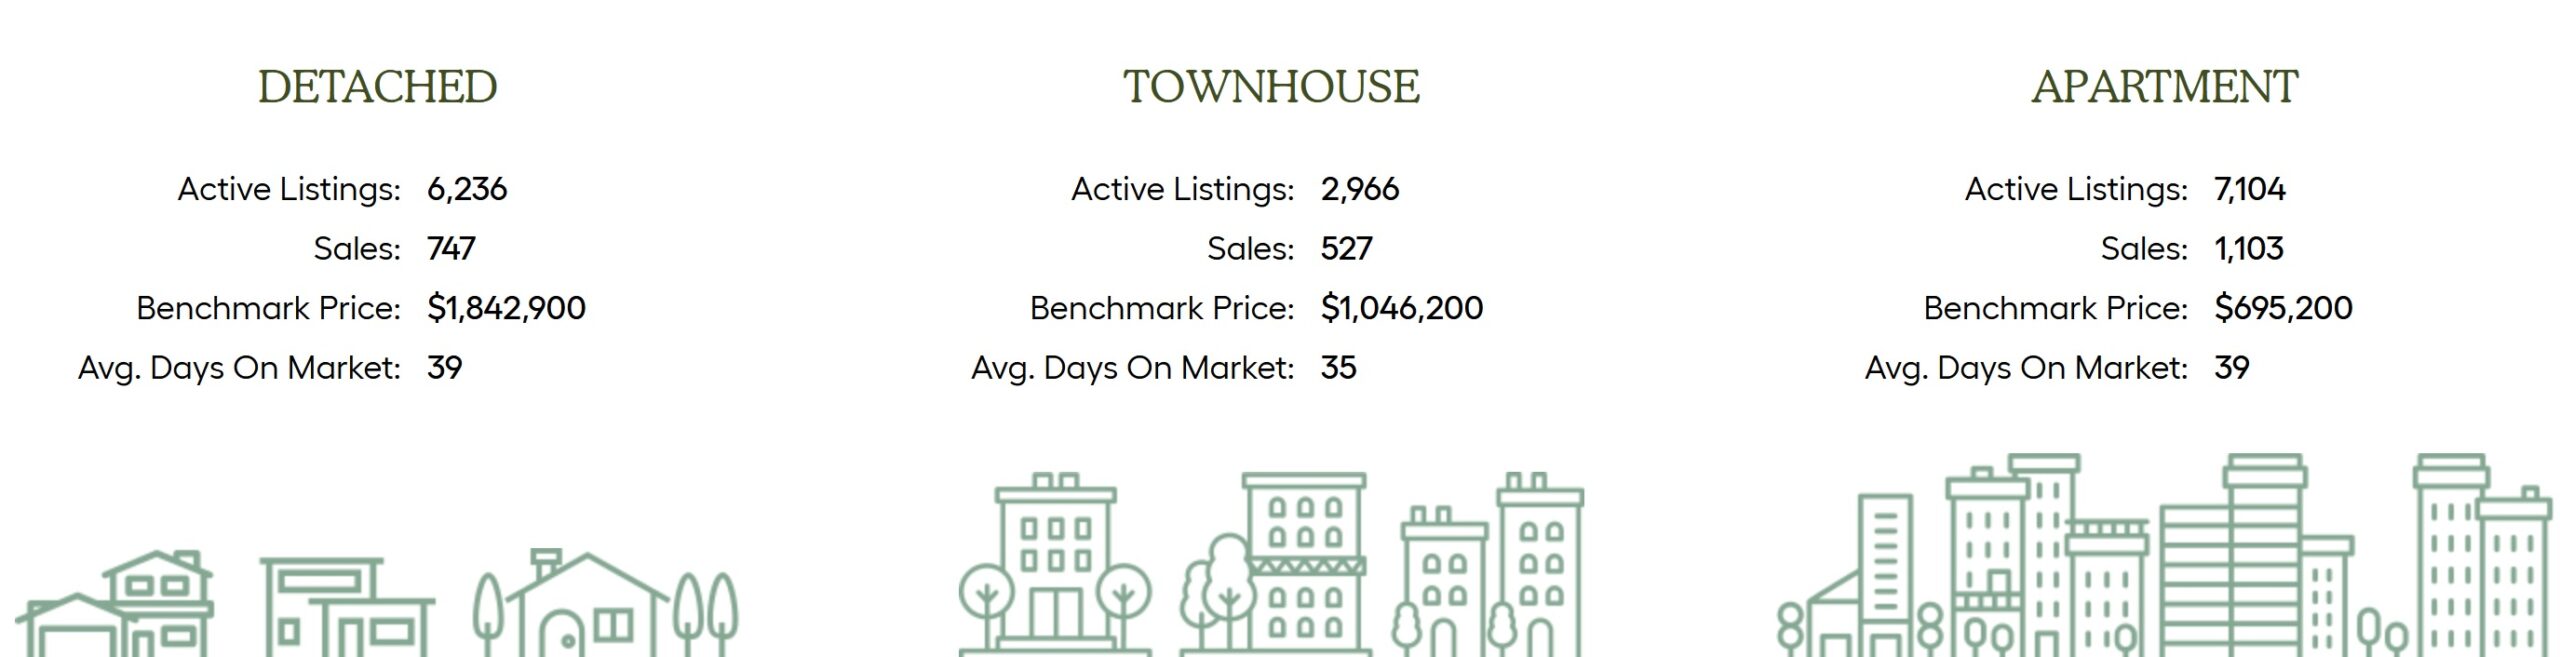
- 747 sales in June
- Up 13.7% from June 2025
- 87 more sales than May
- Benchmark Price: $1,842,900
- Down 7.1% from June 2025
- Down 0.3% from May 2026
Apartment Homes
- 1,103 sales in June
- Up 6.1% from June 2025
- 94 more than May
- Benchmark Price: $695,200
- Down 7.1% from June 2025
- Down 0.4% from May 2026
Attached Homes (Townhouses)
- 527 sales in June
- Up 11.4 % from June 2025
- 64 more than May
- Benchmark Price: $1,046,200
- Down 5% from June 2025
- Up 0.2% from May 2026
Metro Vancouver Market Highlights June 2026:
What’s Driving Trends?
Just over halfway through 2026 and until now the story appears to be a slow awakening. The year began with extremely few sales and mounting supply.
As the months progressed new listings slowly started to ease and buyers cautiously became more active.
Supply is still above the 10-year average and sales are still below the 10-year average…but the situation isn’t as dire as before.
While at this point the story isn’t new. We may be entering a new chapter that is slowly shifting back towards balance.
While prices are still slowly edging down, the rate appears to be slowing.
Speaking generally buyers remain in control. But the question has now become…for how much longer?
For roughly the last year and a half the market has been ‘different’ when compared to what the last decade has taught everyone to expect. As that shift slowly becomes normalized the market continues to adjust towards a new bassline from which it can truly enter in to a new phase where everyone is on the same page.
•••
Expert Insight
Andrew Lis, Director of Economics and Data Analytics at Greater Vancouver REALTORS®, reflects on the latest housing data:
“June saw a pattern of broad gains in home sales across all home types relative to the same time last year, which has been a rare occurrence in recent years. June’s data could be an early sign of a shift in the market.”
Lis looks forward in hopes buyer demand will continue:
“Despite signs that demand is slowly returning to the market, prices haven’t moved much in recent months as the inventory of homes for sale has been big enough to absorb the increased demand.With recent data revealing a slower pace of new listings coming to market, standing inventory is no longer climbing, and may be showing early signs of reversing.”
•••
What This Means for Buyers & Sellers
For Buyers
- Negotiating Power Remains – With 17,017 active listings (30.2% above the 10-year average) and sales 12.4% below the long-term norm, buyers still hold the advantage in most segments of the market. (the question has now become how long will buyer power last?)
- Prices Have Softened Year-Over-Year – The MLS® HPI benchmark is $1,099,100, down 6% year-over-year, with detached homes and apartments both experiencing the largest declines (-7.1%). This environment continues to present opportunity for buyers thinking long term.
- Inventory Is High, But Slowly Tightening – While supply remains elevated, the last few months have posted fewer new monthly listings. Combined with a larger number of sales across the board and the window for buyers could be slowly starting to close if these emerging trends continue.
For Sellers
- Competition Is Still Significant – Even with listings slowly declining inventory remains high meaning strong pricing strategy and standout presentation are essential to attract cautious buyers.
- Slow Downward Pressure – While the market may be shifting all segments are still facing minor downward pressure meaning each month a home sits on the market it, statistically continues to lose value slowly.
- Patience and Exposure Matter More Than Ever – With sales are still 12.4% below the 10-year average that is a large increase from when sales were 30% below not that long ago. Yes buyers are still moving carefully, but at the moment there appears to be more of them. Nonetheless, listings that succeed are the ones that combine strategic pricing, broad marketing exposure, and strong visual presentation to stand out.
•••
Greater Vancouver Home Sales 2026 VS 2025
•••
Looking Ahead
As we move into the second half of 2026, there are growing signs that Metro Vancouver’s market may finally be beginning to shift. Sales have steadily improved, June posted the strongest monthly activity in over a year, and the pace of new listings has slowed over the past two months. While inventory remains historically high, it no longer appears to be growing at the same rate.
Whether these trends mark the beginning of a more balanced market will largely depend on buyer demand. For now, increased sales have been absorbed by elevated inventory, allowing prices to remain relatively stable while continuing their gradual downward drift. If buyers continue returning and the flow of new listings remains subdued, that balance could begin to tilt away from the buyer-favoured conditions we’ve become accustomed to over the past year and a half. However, that likely won’t be a quick transition. Buyers still have time.
That said, the market has repeatedly challenged traditional expectations. Rising sales have not yet translated into meaningful price growth, and historically high inventory continues to give buyers plenty of choice. While momentum appears to be building, it remains too early to call this a turning point.
Right now, the market feels different than it did at the start of the year. Buyers still hold the advantage, but perhaps not by the same margin. If current trends continue through the second half of the year, we may look back on June in December as the month the market began its gradual return toward balance.
CLICK HERE FOR THE FULL GVR June 2026 STATISTICS PACKAGE

Our Google reviews will give you all the confidence you need!
TOP 5 reasons to work with R3 Hayes Real Estate Group

In a market full of noise and hesitation, we’re the steady hand you can trust.
Whether you’re planning ahead or ready to make a move, let’s talk strategy—we’re here to help you come out ahead.

R3 Hayes Real Estate Group – Your Neighbourhood Experts
Call/Text Ryan: 604-561-2127
Follow us on social media for more market updates!