Port Coquitlam Market:
September 2026 vs 2025
Summer pricing slump drags in to fall
Supply increases makes a slight return & sales remain strong for 2/3 of the market
Looking for an accurate picture of where the real estate market is headed?
Today we dive in and take a deeper look at the Port Coquitlam market as a whole:
- A full overview & an in depth look at detached homes, townhouses, & condos focusing on:
- How statistics stack up to the previous month’s activity.
- Where we are standing compared to the same time period in 2025.
- Larger market trends.

•••
Port Coquitlam Benchmark Price Overview:
- Townhouse: We are now at the one year mark. The benchmark has been below 900k for 11 of the last 12 months and under 850k for two months. What was previously unheard of has now become the norm. With September’s benchmark coming in just above 830k we are now hovering around December 2021 pricing…just three months after the benchmark passed 800k for the first time in September 2021.
- Detached: Six of the last nine months have seen prices trend downwards and we now sit between the June-July 2021 benchmark officially erasing much of the historic gains seen in late 2021 through spring 2022.
- Condo: From January to June the condo benchmark went back and forth keeping buyers and sellers on their toes month to month. From June through to September there has been a fairly steep downward trend. Like detached homes condo’s have partially returned to 2021 (pre-boom) pricing firmly planting themselves in a position that makes it unlikely they will break 600k anytime soon; until the benchmark dipped below 600k in fall 2025 it had spent roughly four years above that threshold (baring a month).
Port Coquitlam Market Snapshot (a review):
- Over the last six months the real estate market in Poco has developed as follows:
- After a strong month the market has recoiled in April. Supply has spiked across the board as days on market increase. Sales remain relatively strong, but with supply mounting again it might not be enough before summer sets in and listings grow stale.
- May marks the second straight month of unanimous benchmark price decline. Supply is up everywhere aside from condos, sales remain relatively strong, & days on market improve aside from detached. The detached market, at least month-over-month, is putting forward the weakest performance.
- Purely looking at the benchmark June was one of 2026’s strongest months as all three segments of the market increased. Supply decreased for the attached side of the market, but days on mark increased across the board.
- July was a rough one with sizable benchmark decreases for all three segments of the market. Sales decreased for 2/3 of the market as days on market increased for 2/3.
- The benchmark price took a big hit in August, especially for detached homes. However, sales maintained and days on market came down for 2/3 of the market. Supply decreased across the board. All-in-all outside of price it was a fairly active month.
- Benchmark prices continued on a fairly strong downward trajectory in September, especially townhouses which are now edging closer to an 800k threshold. Days on market increased for 2/3 of the market, while sales maintained for 2/3. Supply increase for attached homes. Despite not seeing the largest benchmark decline the condo sector took the hardest hit in September with sales halved and days on market nearly doubling and supply balloons further.
Year-over-year Comparison:
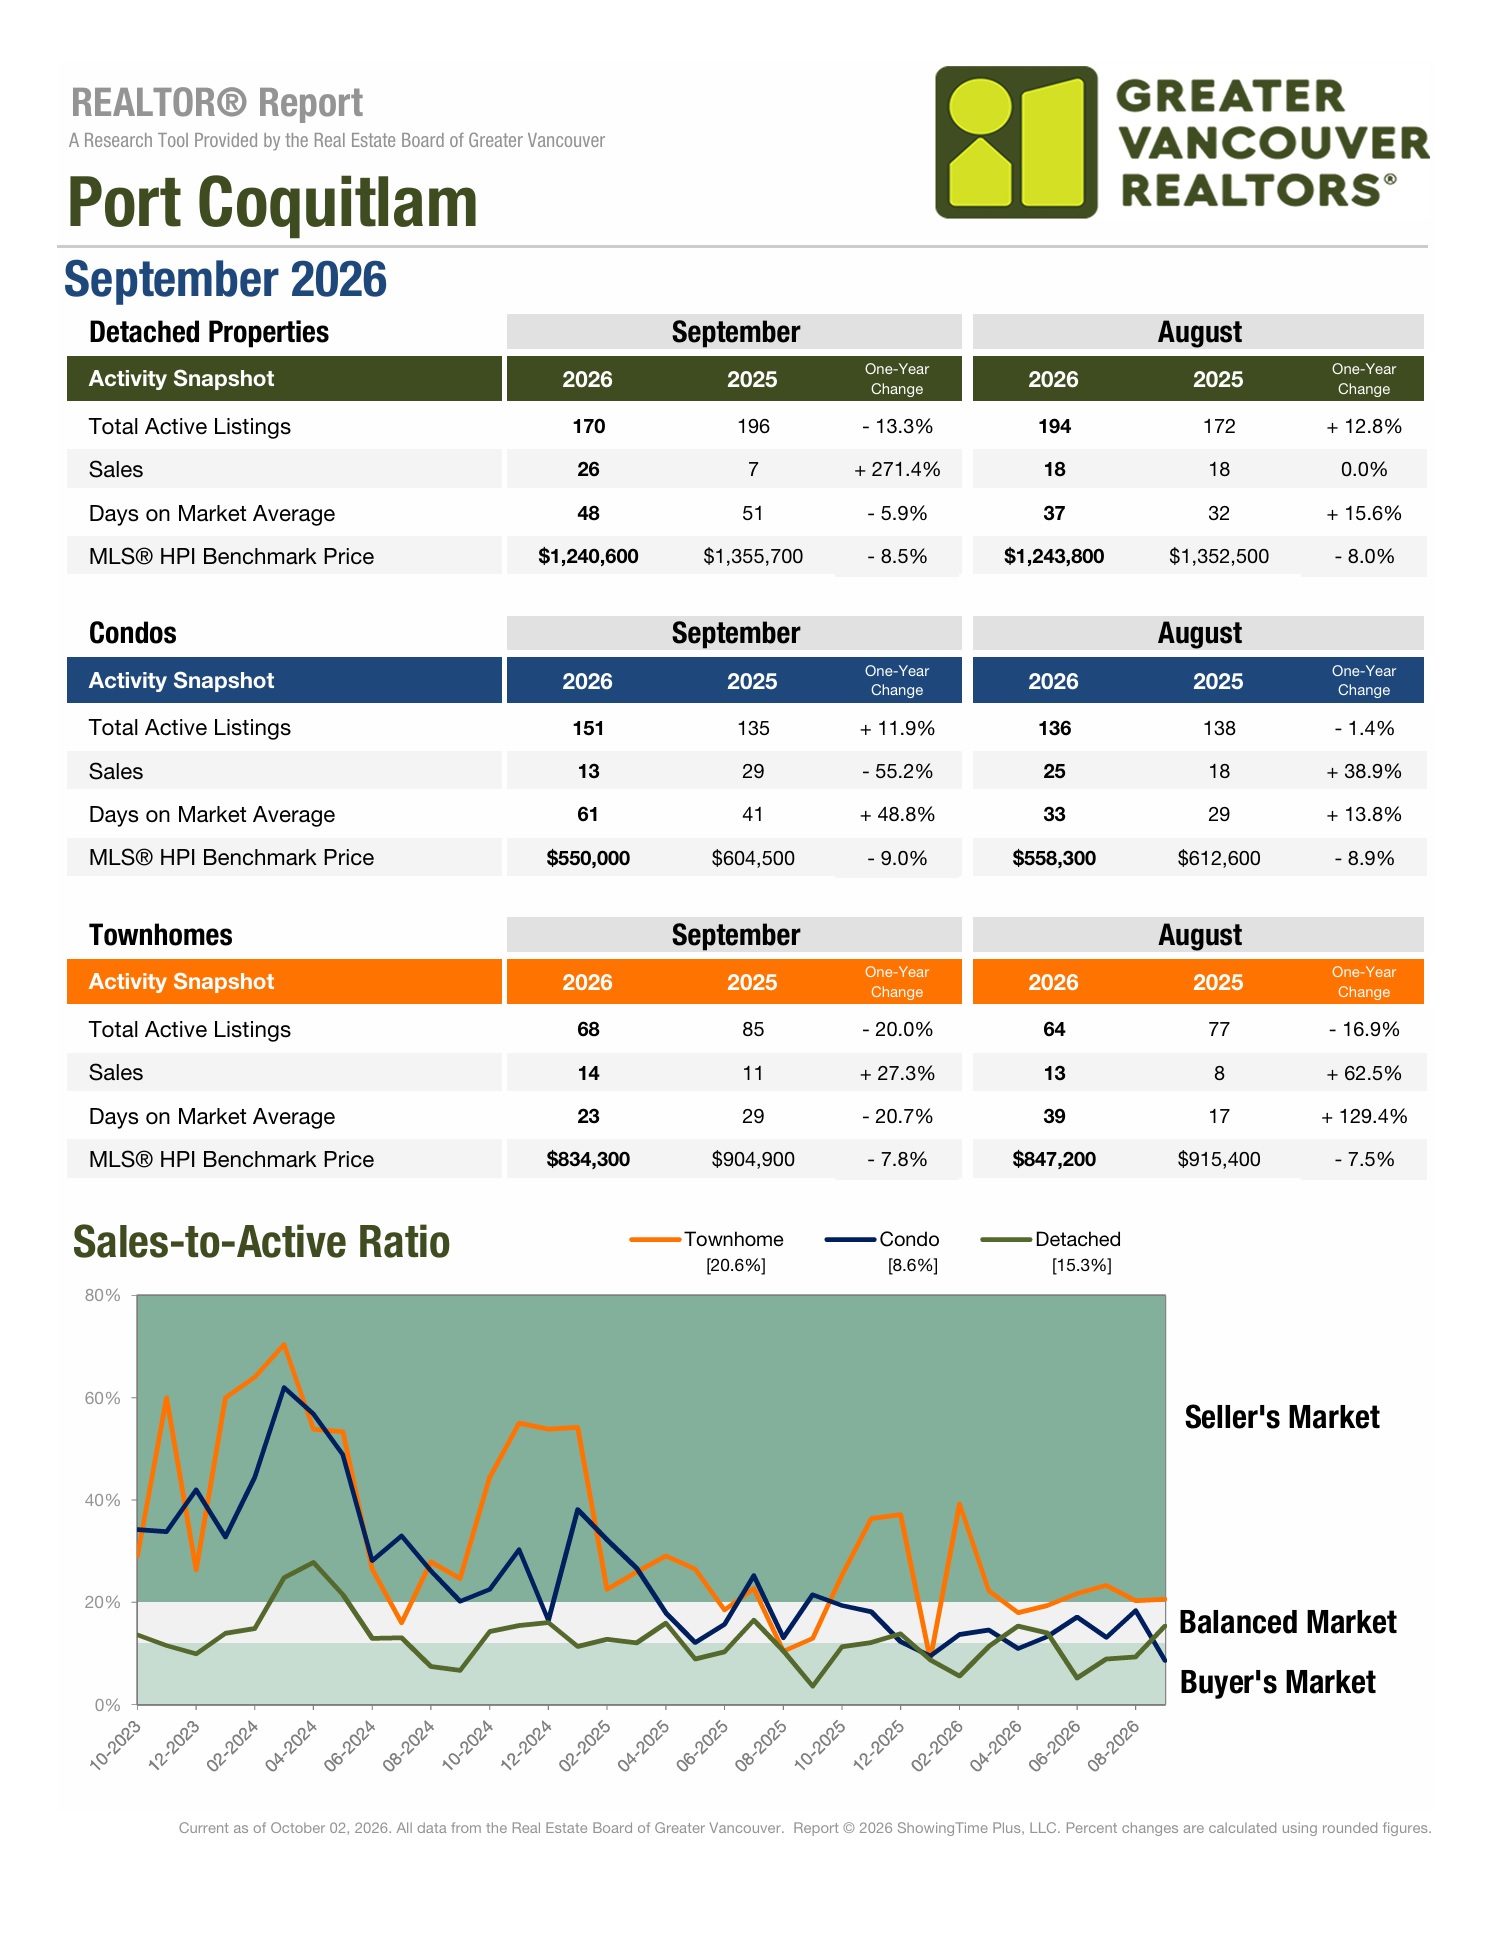
- Year-over- year detached homes health varies. Despite continued monthly decreases supply remains high; it may be below September 2025, but it is on par with August 2025. Day on market have decreased by 5.9% year-over-year, & the benchmark price is down 8.5% (-$115,100). Sales were slow in September 2025 with 2026 up over 271%. A mixed bag.
- Outside of pricing the townhouse market is largely netting positive compared to September 2025. Supply is down by 20% & sales have increased by 27.3%. Days on market are down nearly 21%, but prices are still down $70,600 since September 2025.
- There is no upside to the condo market’s year in review. Active listings are up nearly 12% while sales plummeted over 55%. Days on market continue the bad news by increasing nearly 50%, all while the benchmark has decreased 9% (the highest of all 3 facets of the market). The benchmark is down 54,500, year-over-year.
Overall Supply & Sales Update:
Compared to the same time last year supply is mixed:
- Detached: -13.3%
- Condo: +11.9%
- Townhouse: -20%
Supply varies when September is compared to August:
- Detached: 24 less listings than in August
- Condo: 15 more listings than in August
- Townhouse: 4 more listings than in August
Compared to the same time last year sales vary:
- Detached: +217.4%
- Condo: -55.2%
- Townhouse: +27.3%
Sales vary month over month (compared to August):
- Detached: 8 more sales than August
- Condo: 12 less sales than August
- Townhouse: 1 more sale than August

•••
Detached Market Update:
- September 2026 vs 2025 saw the detached benchmark price decrease by $115,100.
- After August’s colossal $64,700 30-day benchmark drop September did not see any recovery.
- Instead September experienced a $3,200 decrease over August’s numbers.
- The benchmark is now $400 under July 2021. A new 5 year and two month low.
- One of the market’s main issues has been high supply.
- Although supply has now come down three months in a row, and that is positive, there were only 98 active listings in July 2021 when the benchmark was last at this level.
- There are still 72 more active homes to purchase today than last time prices hit this level.
- One bright spot is the number of sales. After both July & August saw 18 monthly sales September jumped to 26. All three months are strong when compared to majority of 2026. In fact, September ties April as the year’s busiest month for sales.
- Main question continues to be, how far will the benchmark have to dip in order to correct surplus supply?
Detached Home Benchmark Pricing:
- October: $1,349,400
- November: $1,358,700
- December: $1,343,000
- January: $1,340,100
- February: $1,347,000
- March: $1,351,300
- April: $1,326,700
- May: $1,320,700
- June: $1,322,600
- July: $1,308,500
- August: $1,243,800
- September: $1,240,600
•••
Townhouse Market Update:
- Since experiencing an early peak in March the townhouse benchmark has dropped $68,400. An average decrease of $11,400 a month for 6 months straight.
- After decreasing for the past three months supply saw a slight uptick in September.
- After reaching their 2026 peak in August days on market took a huge step back in September decreasing by 16.
- The benchmark price is 7.8% below September 2025 which is a 1.7% decrease compared to the July gap (largest year-over-year gap of 2026)
- September 2026 is now $70,600 below the September 2025
- As we are seeing with detached homes the current market situation could still be part of a much larger correction to re-balance prices prior to 2022’s all-time peak where the benchmark increased from a low of ~660k at the start of 2021 to a high of over $1,031,000 in late spring 2022. An increase of roughly $371,000 in a year that never should have naturally occurred.
- The benchmark is now $7,800 above November 2021 pricing. A 58 month, or 4 year and 10 month low. Roughly 50% of the 2022 rush has now been erased.
Townhouse Benchmark Pricing:
- October: $884,300
- November: $893,500
- December: $882,800
- January: $870,000
- February: $864,500
- March: $902,700
- April: $896,900
- May: $885,600
- June: $877,300
- July: $853,300
- August: $847,200
- September: $834,300
•••
Condo Market Overview:
- Outside of March, which set a benchmark high for 2026, the entire year has been negative for the condo benchmark.
- The benchmark price is now $47,200 below 2026 benchmark high. A 7.9% dip in 6 months.
- The benchmark has now decreased twelve of the last fifteen months.
- September’s benchmark is $54,500 lower than September 2025. A 9% dip.
- Supply has varied in 2026:
- Between February & April supply increased by 58.
- Between April & August supply has decreased by 44 nearly erasing the early spring burst.
- Now September has seen a 30 day supply increase of 15 listings.
- For most of 2026 sales have been bolstered by declining prices:
- Sales increased month over month from February to June.
- July saw a sales decrease, but August saw a recovery.
- Sales were down in September by 48% when compared to August.
- Looking at the year as a whole supply is generally heading in a healthy direction and sales remain active. But September was a hard month. Sales dropped and supply ballooned. If buyer’s don’t return for an active fall the condo market could be in for further reductions.
- As with all other metrics September was a hard month for days on market seeing a 46% increase over August.
- September marks 13 months of a sub 600k benchmarks.
- The last time the benchmark was below 600k for more than a single month was prior to it ever breaking 600k in the first place back in March 2022. At this point, halfway to 499k, it is safe to say that there is a low likelihood of seeing a 600k benchmark again any time soon.
- The benchmark is now exactly the same as December 2021, a 57 month low.
For the second month all three segments of the market are planting themselves firmly in 2021 pricing.
Summary:
Port Coquitlam’s summer pricing slump carried into September, with all three housing segments continuing their downward trajectory and firmly returning to 2021 pricing. Yet beneath the falling benchmarks, market conditions are increasingly divided. Detached homes and townhouses maintained healthy sales activity, while condos experienced a particularly difficult month. The question heading deeper into fall is whether improving affordability will be enough to sustain buyer demand.
Detached homes showed encouraging sales activity despite prices reaching another five-year low. The benchmark slipped $3,200 to $1,240,600, now $115,100 below September 2025 and even slightly below July 2021. Supply declined for the third consecutive month, while sales jumped from 18 to 26, tying April for the busiest month of 2026. However, inventory remains substantially higher than when prices last sat at these levels, suggesting the market still has excess supply to absorb.
Townhouses continued their steady correction, but underlying activity remains relatively strong. September’s benchmark fell $12,900 to $834,300, extending a six-month decline of $68,400 from March’s peak. Prices are now at their lowest level in nearly five years, having erased roughly half of the extraordinary gains leading into 2022. Yet compared to September 2025, sales increased 27.3%, inventory declined 20%, and days on market improved nearly 21%. Despite persistent pricing pressure, the townhouse market is showing encouraging signs of balance.
Condos experienced September’s most concerning shift. The benchmark continued its descent, falling 9% year-over-year to a December 2021 level. More troubling was the sudden deterioration in activity: sales dropped 48% from August, inventory increased by 15 listings, and days on market climbed 46%. With prices now down 7.9% from March’s peak and the benchmark below $600,000 for 13 consecutive months, the condo market faces renewed pressure unless buyer activity rebounds.
For the second consecutive month, all three housing segments are sitting at approximately 2021 pricing, reversing much of the extraordinary appreciation that preceded the 2022 peak. While the correction continues, September was not uniformly negative. Stronger detached sales, resilient townhouse demand, and declining detached inventory offer reasons for cautious optimism. The challenge moving forward is whether these improvements can gain enough momentum to stabilize prices—particularly as the condo market struggles to regain its footing.
Our Google reviews will give you all the confidence you need!
TOP 5 reasons to work with R3 Hayes Real Estate Group

In a market full of noise and hesitation, we’re the steady hand you can trust.
Whether you’re planning ahead or ready to make a move, let’s talk strategy—we’re here to help you come out ahead.

R3 Hayes Real Estate Group – Your Neighbourhood Experts
Call/Text Ryan: 604-561-2127
Follow us on social media for more market updates!