Fall Listings Return — But Buyers Remain Patient
Sales Slow. Inventory Rebuilds. Prices Continue Their Gradual Descent.
September brought fresh selection to Greater Vancouver’s housing market, but buyers showed little willingness to pick up the pace.
New listings rebounded from August while sales declined approximately 8%. Inventory rebuilt, the overall sales-to-active listings ratio fell below 12% (which historical means downward pricing pressure will continue), and every major property category recorded another benchmark price decline.
The fall listing season arrived. Unfortunately a corresponding lift in demand did not.
For sellers, that means the summer’s easing supply has yet to translate into stronger leverage. For buyers, September extended a familiar pattern: plenty of choice, limited competition and little pressure to rush.
•••
Greater Vancouver Real Estate Market At A Glance
Residential Sales
- 1,717 homes sold
- Down 8.4% from September 2025
- Approximately 8% lower than August
- 25% below the 10-year September average
New Listings
- 5,852 new listings
- Down 10.3% from September 2025
- Up from 4,100 in August
- 5.7% above the 10-year seasonal average
Active Inventory
- 16,394 homes available
- Up from 15,798 in August
- Down 4% from September 2025
- 24.3% above the 10-year seasonal average
Composite Benchmark Price
- $1,075,900
- Down 0.6% month-over-month
- Down 5.5% year-over-year
The year-over-year supply figures offer some encouragement for sellers: both new listings and active inventory are lower meaning less competition. But when you look at the September numbers compared to August the direction was less favourable for sellers—more homes available and fewer sales.

•••
Has the Summer Inventory Decline Run Its Course?
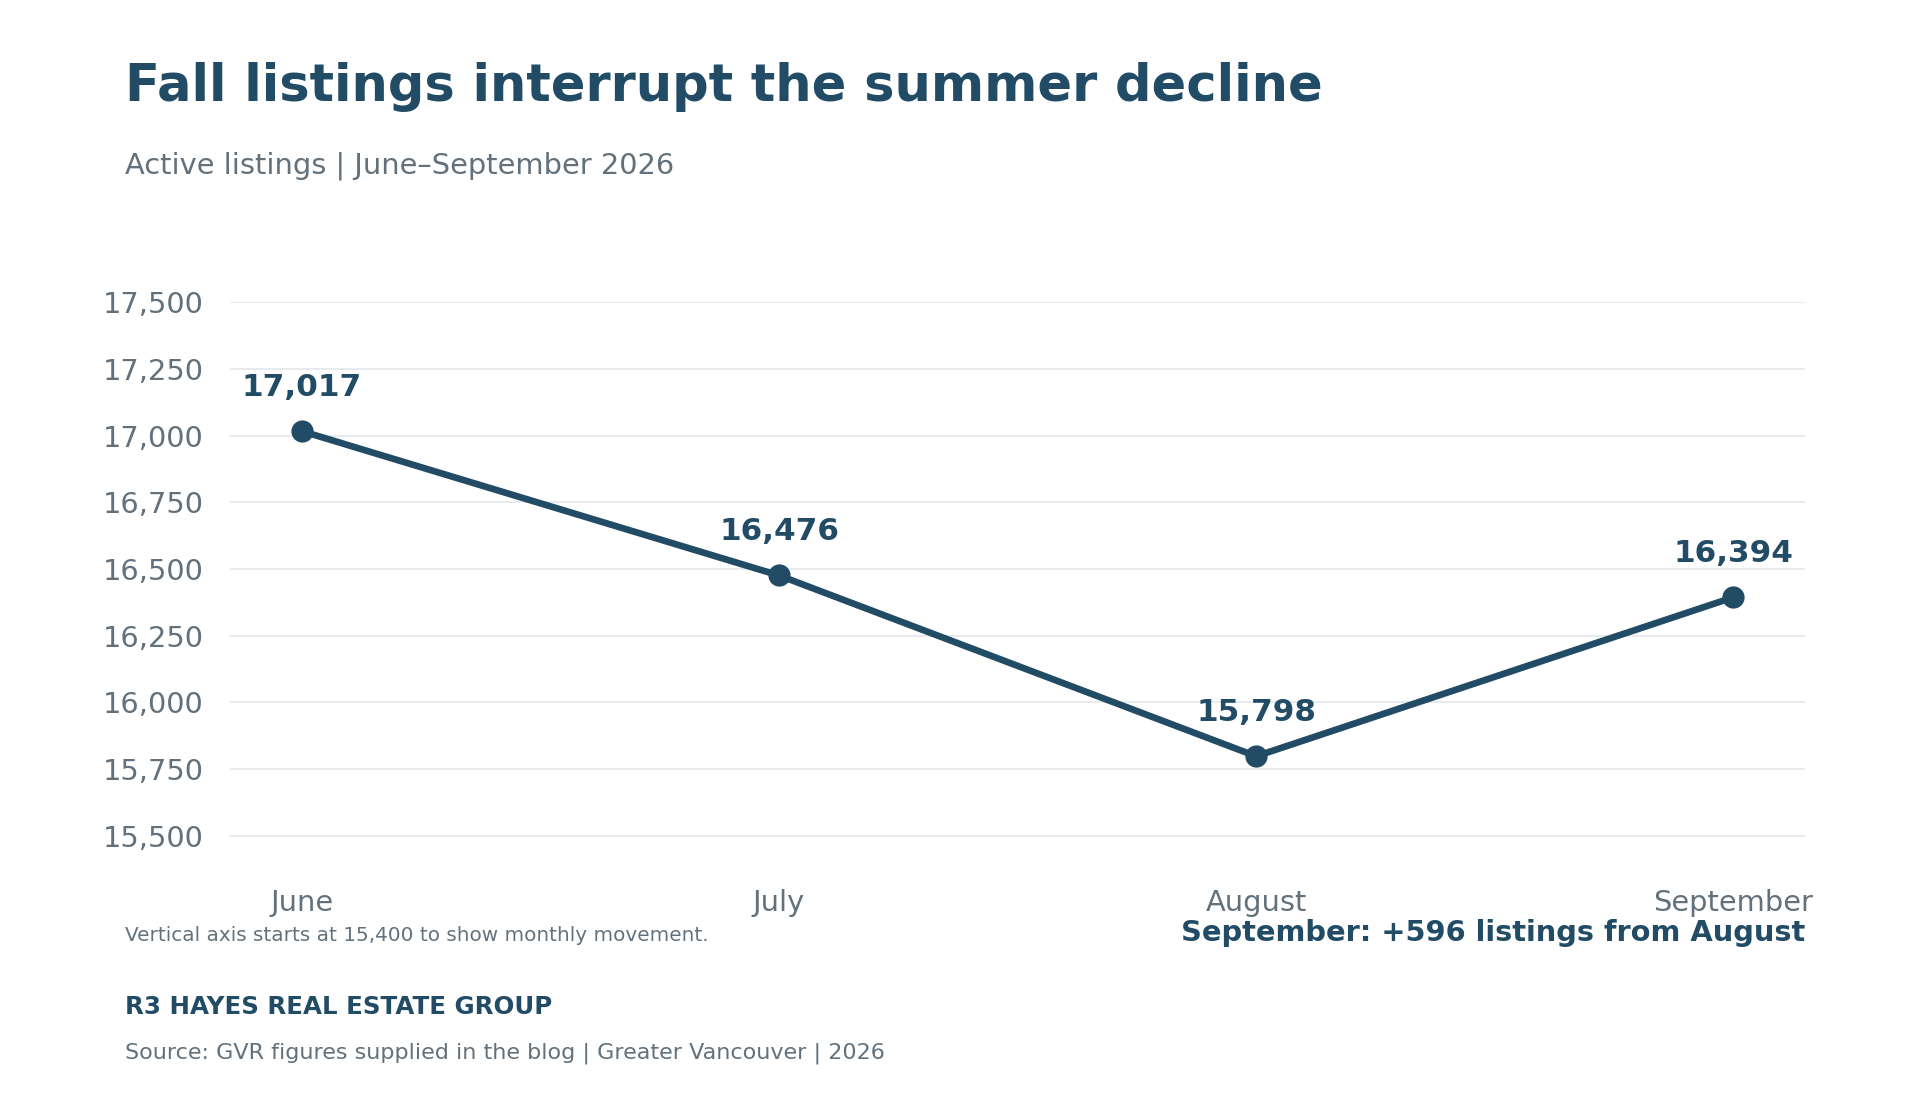
Active inventory fell from approximately 17,017 in June to 16,476 in July, then 15,798 in August. September interrupted that decline, bringing the total back to 16,394 — an increase of almost 600 homes.
A September listing rebound is traditional as sellers return after summer, so this increase alone does not establish a lasting reversal. Inventory also remains below both June’s peak and last September’s level.
While sellers returned to the September market buyers didn’t. And that is the main issue the market is currently facing.
Still, supply sitting 24.3% above the seasonal average leaves buyers with considerably more selection than usual. The summer decline reduced the imbalance; it did not create scarcity.
The question now is whether inventory resumes falling as the year winds down, and whether sales hold up enough for that reduction to matter.
•••
Sales-To-Active Listings Ratio Falls Below 12%
September’s overall sales-to-active listings ratio fell to 10.9%.
- Detached: 9.7%
- Townhouses: 12.2%
- Apartments: 11.4%
GVR’s historical analysis associates sustained ratios below 12% with downward price pressure. Detached homes and apartments sit below that lower threshold. Townhouses remain closest to balanced conditions, but only narrowly above it. Taken together, these ratios suggest buyers retain the stronger negotiating position across the major segments.
•••
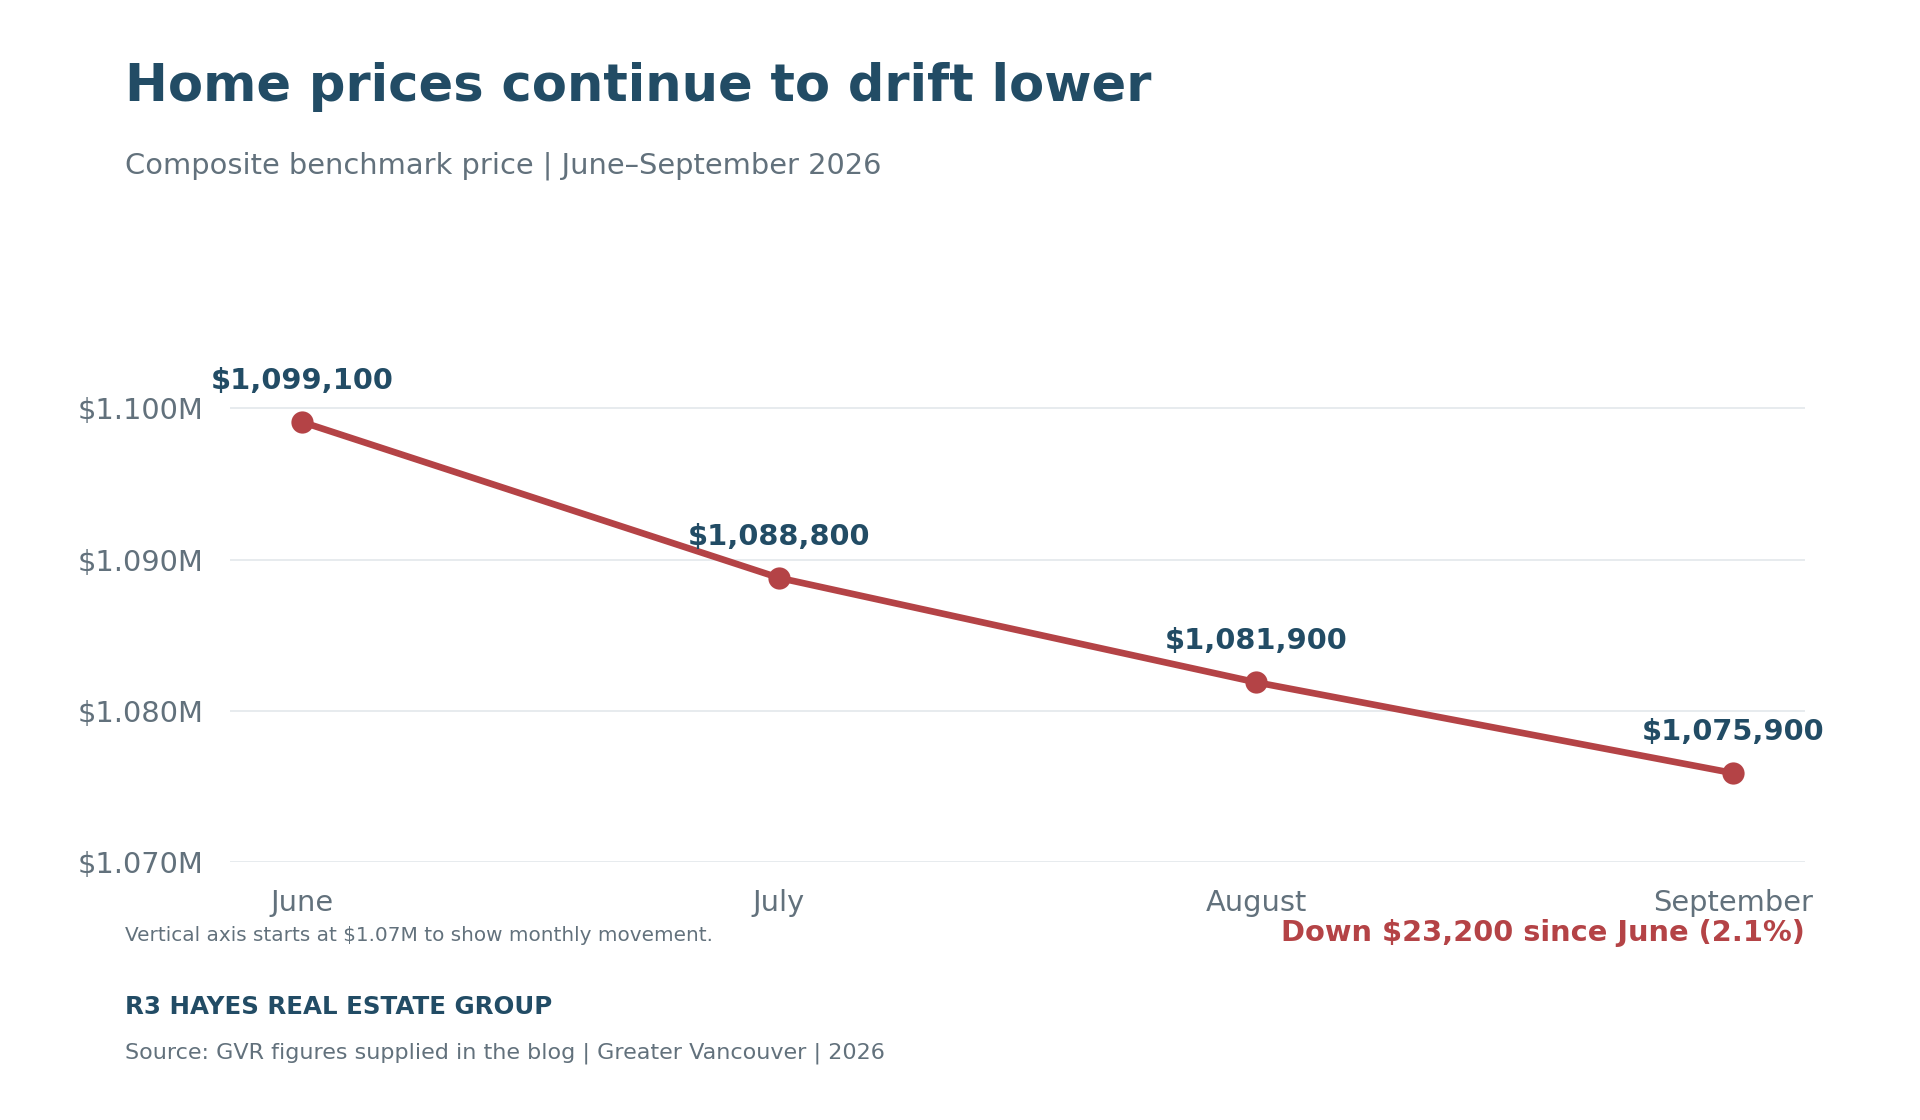
Home Prices Continue to Drift Lower
The composite benchmark’s monthly declines look modest individually. Together, they show a persistent trend:
- June: $1,099,100
- July: $1,088,800
- August: $1,081,900
- September: $1,075,900
That is more than $23,000 lower since June, with all three major property categories declining again in September.
Small monthly changes become meaningful when they keep moving in the same direction.
•••
Property Type Breakdown
Detached Homes
- 575 sales, up 4.2% from September 2025
- Benchmark: $1,784,700
- Down 0.8% from August and 7.3% year-over-year
Detached sales improved year-over-year, yet prices continued falling. Stronger transaction numbers alone are insufficient: demand needs to improve relative to the available supply.
Apartment Homes
- 777 sales, down 18.6% year-over-year
- Benchmark: $682,500
- Down 0.5% from August and 6.2% year-over-year
Apartments accounted for the weakness in overall sales. Detached and townhouse transactions were slightly higher than last September, but the apartment decline pulled total activity down 8.4%. Given condos’ substantial share of transactions, their slower pace matters to the wider market.
Townhouses
- 358 attached sales, compared with 356 in September 2025
- Benchmark: $1,016,700
- Down 1.2% from August and 4.7% year-over-year
Townhouses recorded the largest monthly benchmark decline despite essentially unchanged annual sales. Their comparatively stronger sales to active listing ratio has not insulated them from the broader price trend.
•••
So…What’s Driving This Market?
Elevated inventory remains part of the explanation, but demand is increasingly central. Supply and prices are below last year’s levels, and mortgage conditions have improved from the extremes of several years ago. Sales nevertheless remain unusually subdued.
The shortfall against the 10-year seasonal sales average widened from 18.6% in July to 20.7% in August, then 25% in September.
GVR has identified potential contributors including weaker immigration, reduced investor participation and borrowing costs that have not fallen enough to stimulate a meaningful purchasing surge. Broader economic uncertainty also encourages caution.
Meanwhile, buyers have learned that patience is rarely being punished. With fresh listings arriving and prices drifting lower, many see little reason to accelerate their search.

•••
What This Means for Buyers
Buyers benefit from above-normal selection, below-normal sales activity and declining benchmarks across every major category. The overall 10.9% ratio further supports negotiating leverage.
Exceptional homes priced appropriately can still attract strong interest, so these conditions do not make every property equally negotiable.
The challenge is deciding when to act. Nobody can reliably identify the bottom in advance. For buyers planning to stay for years, the useful question is whether today’s selection, price and terms make the right home attainable.
What This Means for Sellers
Price remains critical. Buyers can compare more alternatives, and a home launched above their perception of value can lose momentum quickly.
Focus on recent completed sales, competing listings, days on market and the direction of prices. Values from several months ago may no longer reflect what buyers will pay today.
As benchmarks decline, sellers who adjust early are better positioned than those repeatedly chasing the market downward.
•••
Looking Ahead: Can Falling Inventory Stabilize Prices?
September extended the gradual erosion in prices without producing the demand rebound sellers hoped for. Inventory remains below its early-summer high, and detached and townhouse sales held up better year-over-year than apartments. But abundant choice and weak overall activity continue to favour buyers.
The next development to watch is the relationship between inventory and sales.
If listings resume their usual late-fall decline while sales hold steady, negotiating conditions could improve for sellers heading into winter. If sales weaken alongside supply, price pressure may persist. Stubbornly high inventory would leave buyers with continued leverage.
This market’s changes are accumulating: another modest benchmark decline, another seller adjusting expectations, a little more negotiating room. Together, those shifts are reshaping values.
Whether that process slows will depend on supply tightening enough, relative to demand, to change buyers’ willingness to wait.
CLICK HERE FOR THE FULL GVR September 2026 STATISTICS PACKAGE

Our Google reviews will give you all the confidence you need!
TOP 5 reasons to work with R3 Hayes Real Estate Group

In a market full of noise and hesitation, we’re the steady hand you can trust.
Whether you’re planning ahead or ready to make a move, let’s talk strategy—we’re here to help you come out ahead.

R3 Hayes Real Estate Group – Your Neighbourhood Experts
Call/Text Ryan: 604-561-2127
Follow us on social media for more market updates!