Port Coquitlam Market:
April 2026 vs 2025

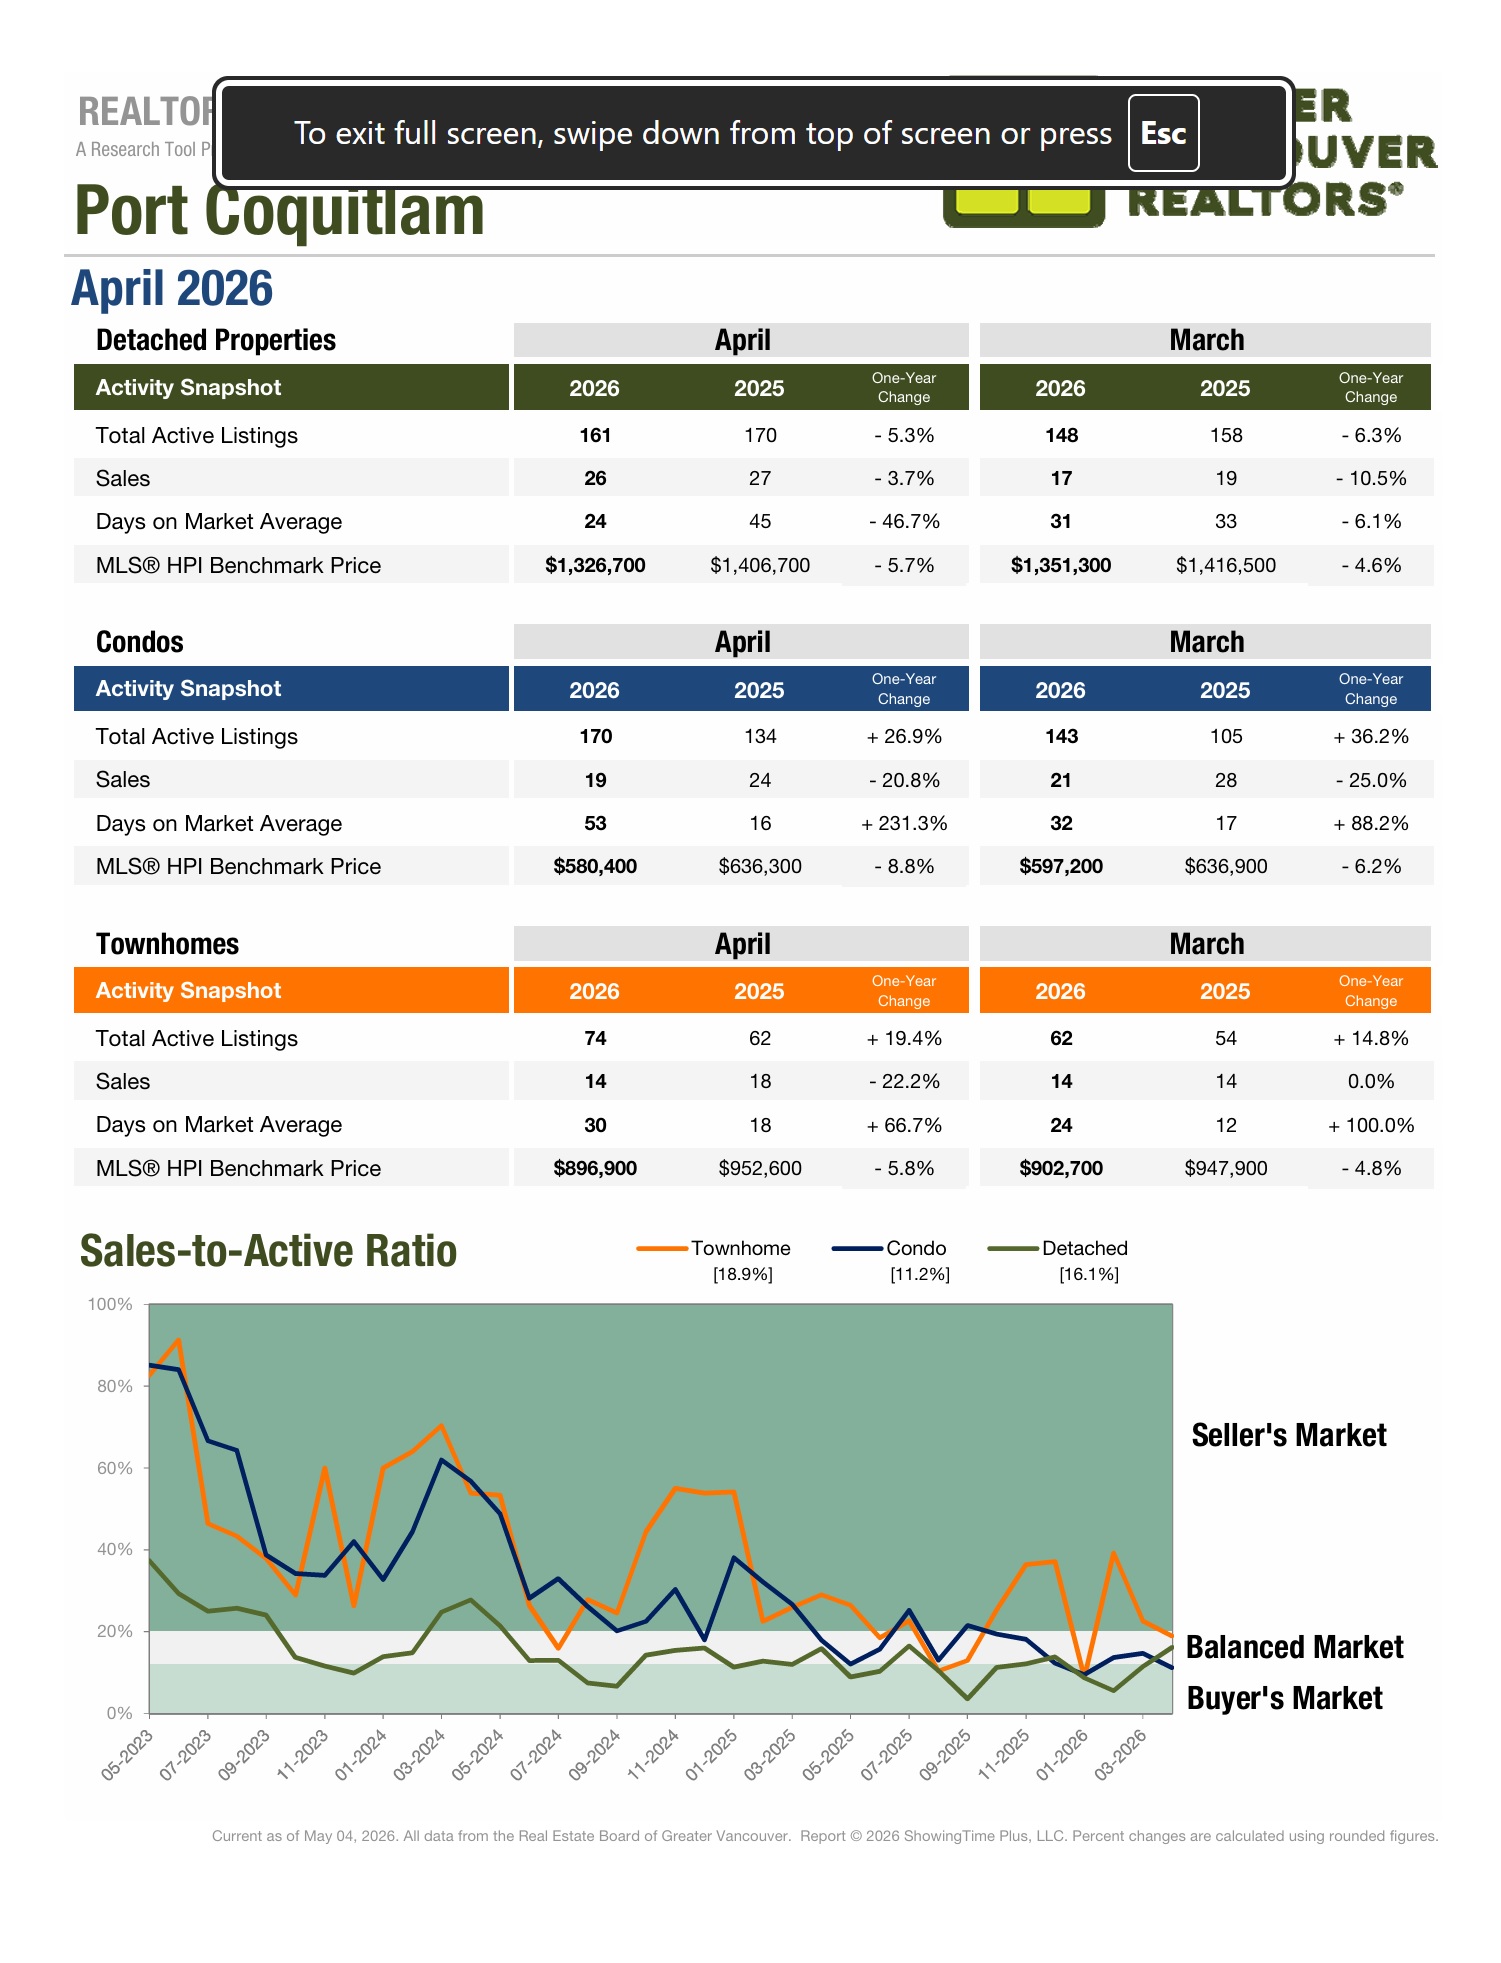
After achieving 2026 benchmark highs in March prices are down across the board
Supply surges & days on market increase.
Looking for an accurate picture of where the real estate market is headed?
Today we dive in and take a deeper look at the Port Coquitlam market as a whole:
- A full overview & an in depth look at detached homes and townhouses. Both focusing on:
-
- How statistics stack up to the previous month’s activity.
- Where we are standing compared to the same time period in 2024.
- Larger market trends.

•••
Port Coquitlam Benchmark Price Overview:
- Townhouse: After five months of sub-900k benchmarks, March broke the streak with a 38k+ increase. 30-days later & April has adjusted downwards, but only slightly. Potentially balancing out March’s over-correcting jump-up. However, the benchmark is back below 900k.
- Detached: December finished 2025 at a new low for the year, and although 2026 started with a further dip February bounced back above December. March continued the push up with the first back-to-back monthly increases since May-June of last year. After a ray of hope for the detached benchmark April was a speed bump seeing a 24k+ decline pushing the market back to March 2023 price levels.
- Condo: For the last 6 months of 2025 the condo market took a sudden and large turn downwards.
- 2026 has introduced yo-yo pricing. January was up, February was down, March was up, and now April is down.
- The benchmark has been under 600k since October of last year. The last time it dipped below 600k was December 2022. And even then it was only sub 600k for a single month.
- The first time the benchmark surpassed 600k was March 2022 & the benchmark is now 8k below February 2022.
Port Coquitlam Market Snapshot (a review):
- Over the last six months the real estate market in Poco has developed as follows:
- Relatively speaking November was a strong month. Benchmark prices increased across the board as supply decreased, and sales remained steady. But prices are historically low & supply remains inflated.
- This year a December slowdown really set in. We finished the year with falling prices, month over month sales declines and a supply reduction. Despite prices coming down and supply doing its best to get back to a manageable level the power is still in the hands of hesitant buyers who seem to be waiting for a bottom that has yet to crystalize.
- 2026 began with sales decreasing across the board as supply took massive step up for townhouses while remaining high for condos and detached homes. In January 2/3 of the market saw a price dip while condos saw a slight leveling while remaining at a multi-year low.
- In February detached homes were the only facet of the market to see sales decrease further. Townhouses saw their sales quadruple. Active listing saw a positive reduction for attached listings while detached homes saw a large spike upwards.
- On the whole March was a strong month for the market and a potential first spring pop. Benchmark prices were up across all market segments and both detached homes and condos saw their sales increase and days on market reduce. However, supply has once again taken a step up for all housing styles.
- After a strong month the market has recoiled in April. Supply has spiked across the board as days on market increase. Sales remain relatively strong, but with supply mounting again it might not be enough before summer sets in and listings grow stale.
Year-over-year Comparison:
- Year-over- year the detached market is on a unique place. Yes days on market and supply are down…but they are being compared to a year which was deemed as a two decade anomaly. Active listings are down 5.3% but they could easily be cut in half and the market would still be deemed active. Despite prices being down nearly 6% (80k) sales haven’t recovered & are down 3.7% compared to 2025.
- Ever metric for the townhouse market is showing regression compared to 2025. Supply is up nearly 20% while sales are down 22.2%, a perfect mixed for further benchmark decline. Active listings to sale ratio has caused days on market to increase nearly 67% compared to 2025…and all of this is with a 5.8% year-over-year benchmark decrease ($55,700),
- Compared to April 2025 condos have been the hardest hit. The gap between active listings and sales is vast. Nearly a 27% supply increase with a 20.8% sales decrease. Meanwhile days on market have skyrocketed by nearly 215% even with a price decrease of 8.8%, the highest within the market.
Overall Supply & Sales Update:
Compared to the same time last year supply is mixed:
- Detached: -5.3%
- Condo: +26.9%
- Townhouse: +19.4%
Supply has increased when April is compared to March:
- Detached: 13 more listings than in March
- Condo: 27 more listings than in March
- Townhouse: 12 more listings than in March
Compared to the same time last year sales trend downwards:
- Detached: -3.7%
- Condo: -20.8%
- Townhouse: -22.2%
Sales vary month over month (compared to March):
- Detached: 9 more sales than March
- Condo: 2 less sales than March
- Townhouse: sales remained equal

•••
Detached Market Update:
- April 2026 vs 2025 sees the detached benchmark price decrease by $82,200.
- Since October there have been six months where the benchmark has been below April 2023.
- At this point it is safe to say the detached market is squarely in spring 2023 pricing.
- One of the market’s main issues has been balancing high supply with a cautious buyer pool.
- While 2025 ended with sustained supply decreases 2026 has been plagued with a return to increasing oversupply. April was the third straight month to see a supply increase.
- The one bright spot in the detached market is sales. In March sales more than doubled month-over-month and April has continued to build on that momentum.
- Last time the benchmark was this low there were only 66 active listings. Currently there are 95 more listings in April when compared to April 2023.
- The market still needs a refresh. Fewer new listings, and a continued active buyer pool to purchase the remaining stock. That being said spring continues with many positive indicators; building sales and continued decreasing days on market.
- After increasing $4,300 to a 2026 benchmark high in March. The last 30-days have seen prices tumble by $24,600 to a new 2026 low. A 36-month low.
Detached Home Benchmark Pricing:
- April: $1,408,900
- May: $1,412,000
- June: $1,382,900
- July: $1,359,500
- August: $1,356,600
- September: $1,361,800
- October: $1,349,400
- November: $1,358,700
- December: $1,343,000
- January: $1,340,100
- February: $1,347,000
- March: $1,351,300
- April: $1,326,700
•••
Townhouse Market Update:
- February was first time in six months the update wasn’t all bad news. Yes the benchmark price took another step down, but there was also a massive uptick in sales and a marginal decrease in supply. March followed up with a huge benchmark increase, but fewer sales, higher supply, and a longer days on market average.
- Unfortunately April was a speed bump. Active listings increased along with days-on-market, while the benchmark decreased back below 900k.
- The benchmark price is 5.8% below April 2025. A increase of 1% vs March 2026 vs 2025 4.8% decrease.
- After rebounding $38,200 in 30 days and setting a benchmark high for 2026 the benchmark decreased $5,800 in April. Still with a 60-day increase of $32,400.
- Despite the 60-day increase other factors in the townhouse market continue to create uncertainty around future pricing movement. The current market situation could still be part of a larger correction to re-balance prices prior to 2022’s all-time peak where the benchmark increased from a low of ~660k in 2021 to a high of over $1,031,000 in 2022.
Townhouse Benchmark Pricing:
- April: $955,400
- May: $956,300
- June: $949,600
- July: $945,200
- August: $917,900
- September: $913,800
- October: $884,300
- November: $893,500
- December: $882,800
- January: $870,000
- February: $864,500
- March: $902,700
- April: $896,900
•••
Condo Market Overview:
- Before taking a positive step forward in March six of the last nine months had marked new low points for the condo market.
- Just like the detached and townhouse market condos stumbled directly after setting a 2026 benchmark high in March.
- The benchmark price is down $16,800 in the last 30-days fully erasing the $8,300 seen in March.
- The benchmark has now decreased eight of the last 10 months.
- April’s benchmark is $55,900 lower than April 2025. A massive 8.8% dip.
- For eight of the last eleven months active listings decreased Unfortunately they have increased by 58 in the last 60 days. Previously it had appeared as though they may finally drop below 100…& now they are back up on their way to 200.
- After sales increased for two back-to-back months they decreased in April. However, April’s sales were still above February’s despite the decrease.
- Despite relatively strong sales in relation to the last 6 months, year-over-year sales are still down 20.8%, coupled with 26.9% more supply when compared to April 2025. High supply and low sales are not an ideal mix for sellers.
- April is now the 8th straight month with a sub 600k benchmark.
- The last time the benchmark was below 600k for more than a single month was prior to it ever breaking 600k in the first place back in 2021. It has never dipped below 600k after surpassing it for this long before.
Summary:
Port Coquitlam’s market lost momentum in April after March’s broad pricing rebound. All three segments saw benchmark declines as supply surged higher and days on market increased across the board. Sales activity remained relatively steady in parts of the market, but rising inventory is once again putting pressure on pricing.
Detached homes saw the sharpest reversal. The benchmark fell $24,600 to $1,326,700—a new 36-month low and a return to spring 2023 pricing levels. Inventory increased for a third straight month, though improving sales remain one of the market’s few bright spots.
Townhouses slipped back below $900,000 after March’s sharp rebound, landing at $896,900. Supply and days on market increased while sales remained flat, suggesting the segment is still working through a broader re-balancing. Prices are now down 5.8% year-over-year.
Condos remain the weakest segment. April erased March’s gains, with the benchmark now down 8.8% from last year while supply continues climbing and sales soften. The benchmark has now remained below $600,000 for eight consecutive months.
Overall, April showed that March’s momentum was not yet a full turnaround. Buyer activity has improved from winter lows, but rising supply and softening prices continue to shape the market heading into summer.
Our Google reviews will give you all the confidence you need!
TOP 5 reasons to work with R3 Hayes Real Estate Group

In a market full of noise and hesitation, we’re the steady hand you can trust.
Whether you’re planning ahead or ready to make a move, let’s talk strategy—we’re here to help you come out ahead.
![]()
R3 Hayes Real Estate Group – Your Neighbourhood Experts
Call/Text Ryan: 604-561-2127
Follow us on social media for more market updates!