Port Coquitlam Market:
July 2026 vs 2025
After a June reprieve prices take a large hit.
Supply has decreased across the board.
Looking for an accurate picture of where the real estate market is headed?
Today we dive in and take a deeper look at the Port Coquitlam market as a whole:
- A full overview & an in depth look at detached homes, townhouses, & condos focusing on:
- How statistics stack up to the previous month’s activity.
- Where we are standing compared to the same time period in 2024.
- Larger market trends.

•••
Port Coquitlam Benchmark Price Overview:
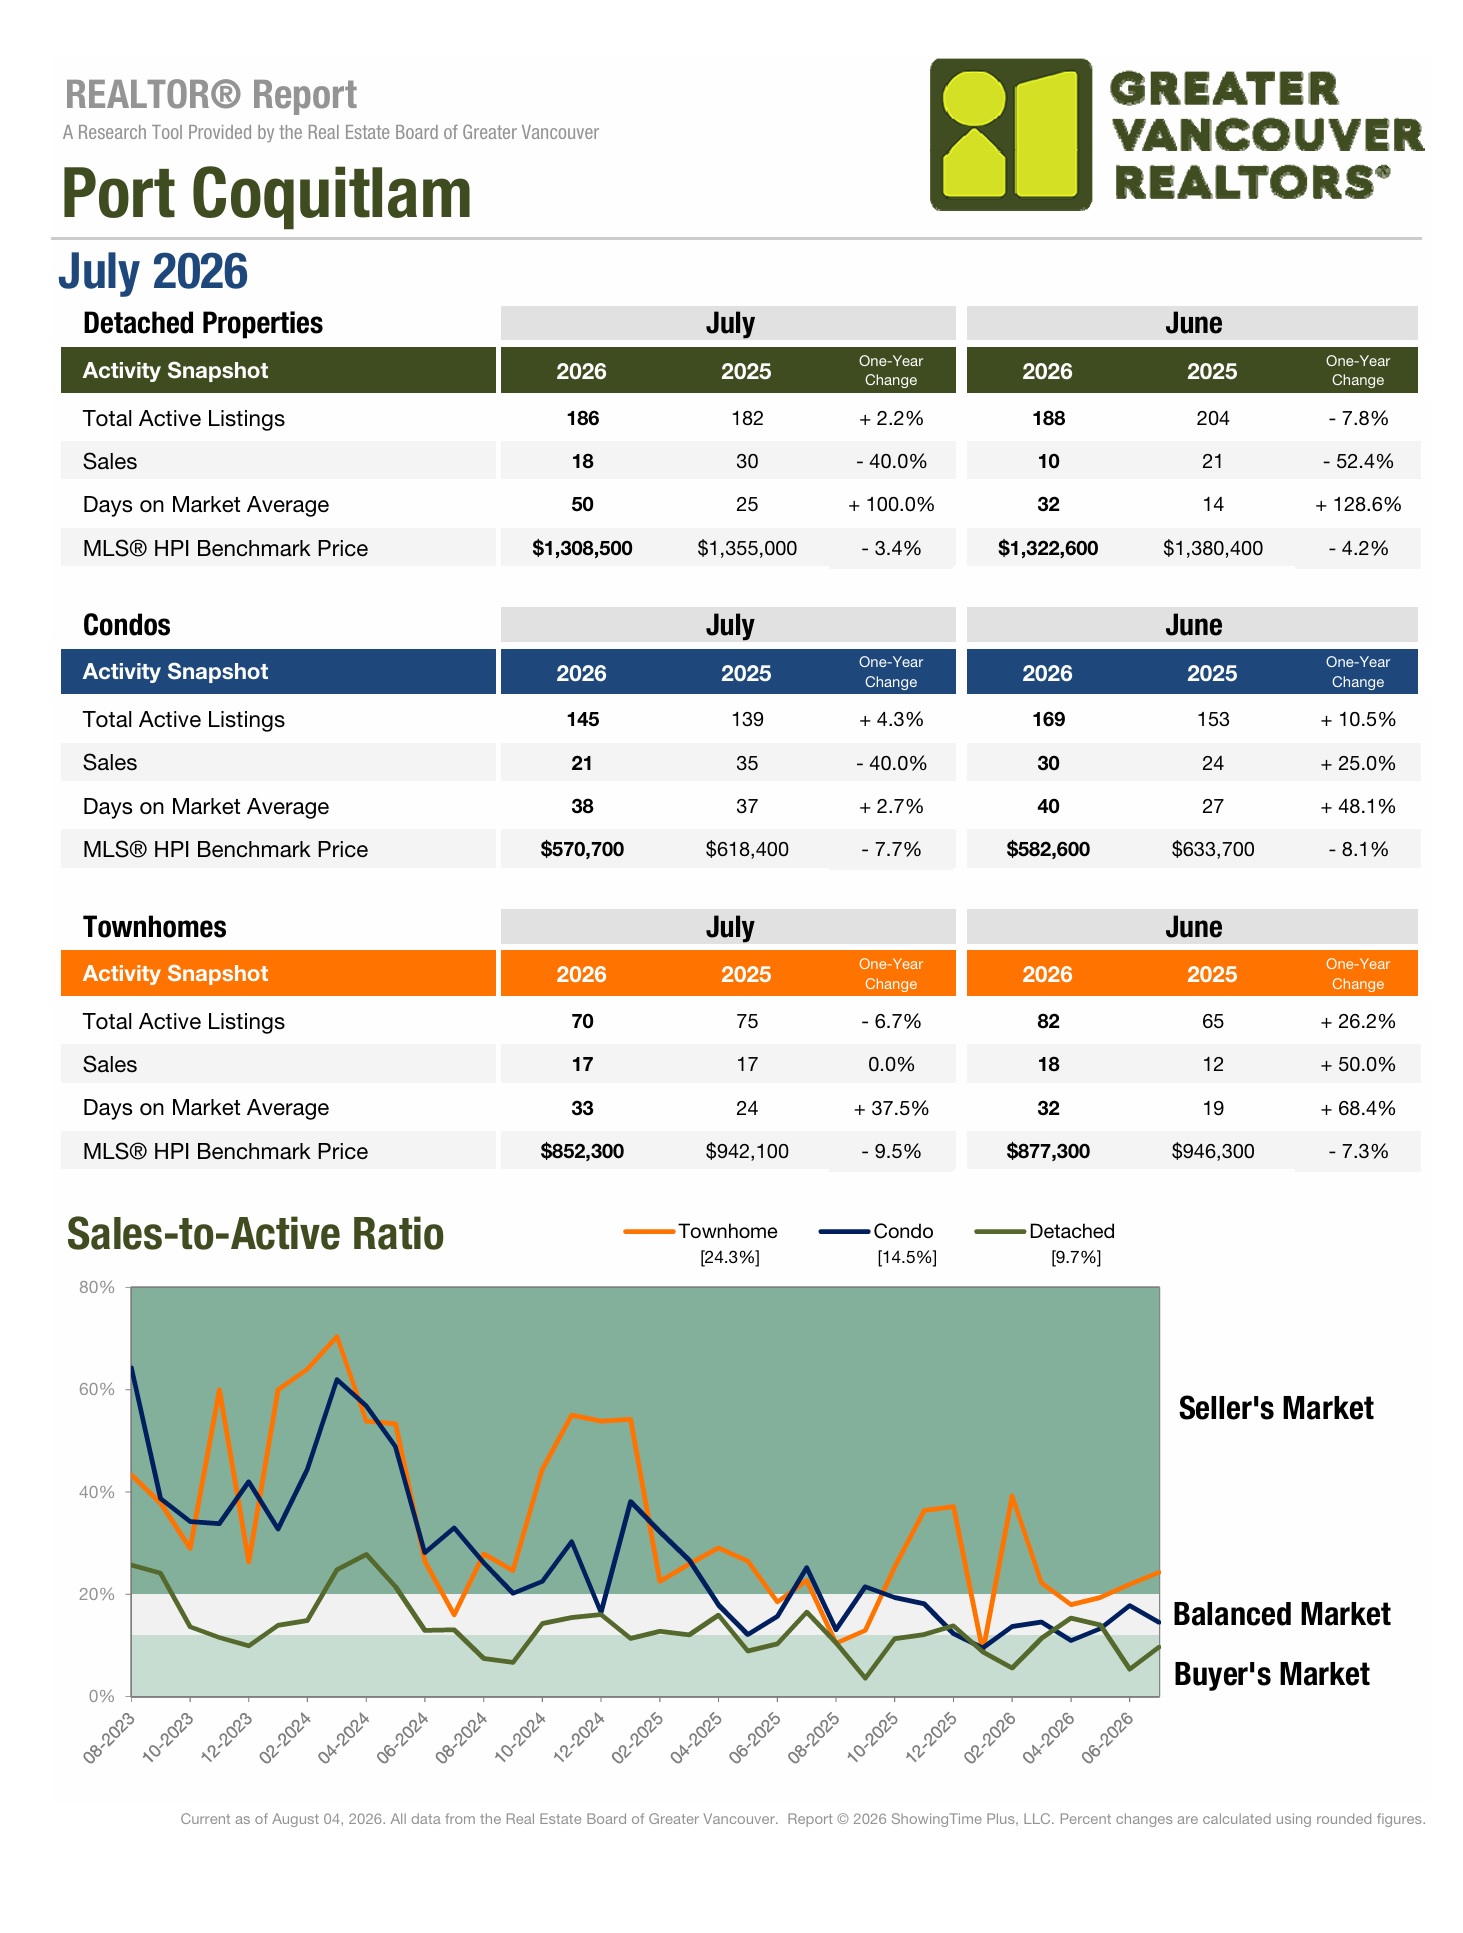
- Townhouse: After five months of sub-900k benchmarks, March broke the streak with a 38k+ increase. Four months later, the townhouse market erased those gains entirely, proving it is the weakest facet of the Poco market.
- Detached: February & March remain the one true bright spot in the 2026 detached market. Outside of an extremely minor uptick in June prices have been trending downwards and we now sit below the March 2023 benchmark officially butting up against the turbulent price variations of 2022.
- Condo: The first 4-months of 2026 saw yo-yo pricing. January was up, February was down, March was up, and April is down. May breaks this pattern with a second month of decline..albeit an extremely minor one. June may have fought back with an benchmark increase, but July was a large step backwards.
- The benchmark has been under 600k since October of last year. The last time it dipped below 600k was December 2022. And even then it was only sub 600k for a single month.
- The benchmark is now nearly 18k below February 2022 making it closer to January 2022 pricing. Both pre-2022 boom.
Port Coquitlam Market Snapshot (a review):
- Over the last six months the real estate market in Poco has developed as follows:
- In February detached homes were the only facet of the market to see sales decrease further. Townhouses saw their sales quadruple. Active listing saw a positive reduction for attached listings while detached homes saw a large spike upwards.
- On the whole March was a strong month for the market and a potential first spring pop. Benchmark prices were up across all market segments and both detached homes and condos saw their sales increase and days on market reduce. However, supply has once again taken a step up for all housing styles.
- After a strong month the market has recoiled in April. Supply has spiked across the board as days on market increase. Sales remain relatively strong, but with supply mounting again it might not be enough before summer sets in and listings grow stale.
- May marks the second straight month of unanimous benchmark price decline. Supply is up everywhere aside from condos, sales remain relatively strong, & days on market improve aside from detached. The detached market, at least month-over-month, is putting forward the weakest performance.
- Purely looking at the benchmark June was one of 2026’s strongest months as all three segments of the market increased. Supply decreased for the attached side of the market, but days on mark increased across the board.
- July was a rough one with sizable benchmark decreases for all three segments of the market. Sales decreased for 2/3 of the market as days on market increased for 2/3.
Year-over-year Comparison:
- Year-over- year the detached is down across all metrics. High supply has stubbornly maintained, sales are down 40% while day on market have doubled. Despite prices already being in a pattern of decline in July 2025 they are still down 3.5% year-on-year.
- In terms of pricing the townhouse market has been hit the hardest year-over- year with a 9.5% decline ($89,800). Total active listing have decreased slightly while sales have held. Days on market have increased by nearly 40%.
- Like detached homes the condo market suffers year-over-year across all metrics. The benchmark is down $47,700 while extreme elevated supply managed to climb 4.3%. Sales are down 40% and days on market have creeped up slightly.
Overall Supply & Sales Update:
Compared to the same time last year supply is mixed:
- Detached: +2.2%
- Condo: +4.3%
- Townhouse: -6.7%
Supply has decreased when July is compared to June:
- Detached: 2 less listings than in June
- Condo: 24 less listings than in June
- Townhouse: 12less listings than in June
Compared to the same time last year sales are generally trending downwards:
- Detached: -40%
- Condo: -40%
- Townhouse: 0.0%
Sales vary month over month (compared to June):
- Detached: 8 more sale than June
- Condo: 9 less sales than June
- Townhouse: 1 less sales than June

•••
Detached Market Update:
- July 2026 vs 2025 sees the detached benchmark price decrease by $46,500.
- For the last four months the benchmark has been below April 2023. At this point it is safe to say the detached market is squarely at spring 2023 pricing.
- One of the market’s main issues has been high supply.
- 2026 has been plagued with increasing oversupply. While July saw supply level off, June was the fifth straight month to see a supply increase.
- For a three month period starting in March the bright spot in the detached market was sustained sales strength. But sales plunged downwards in June and while July recovered slightly sales remain low.
- Last time the benchmark was this low there were only 66 active listings. Currently there are 120 more listings in July when compared to April 2023.
- Main question is will the benchmark have to dip below 1.3 to sell through the oversupply?
- Directly after hitting a benchmark high in March, April saw a new 2026 low. The downward momentum continued with May setting another low-point for 2026. While June was a minor reprieve July is now A new 39-month low.
Detached Home Benchmark Pricing:
- August: $1,356,600
- September: $1,361,800
- October: $1,349,400
- November: $1,358,700
- December: $1,343,000
- January: $1,340,100
- February: $1,347,000
- March: $1,351,300
- April: $1,326,700
- May: $1,320,700
- June: $1,322,600
- July: $1,308,500
•••
Townhouse Market Update:
- Since experiencing an early peak in March the townhouse benchmark has dropped $49,400. An average decrease of $12,350 a month.
- Active listings have decreased for the past two months but days on market have increased.
- In the last year there were exactly 6 months with a lower supply. At this point supply is at a middle ground.
- The benchmark price is 9.5% July below 2025. A increase of 2.2% vs June 2026 vs 2025 and an increase of 2.4% vs May 2026 vs 2025.
- The year-over-year price decrease is widening despite July 2025 already being in a toward cycle.
- July 2026 is now $89,800 below the July 2025
- The current market situation could still be part of a much larger correction to re-balance prices prior to 2022’s all-time peak where the benchmark increased from a low of ~660k in 2021 to a high of over $1,031,000 in 2022. An increase of roughly $371,000 in a year that never should have naturally occurred.
- The benchmark is now $3,300 above December 2021 pricing. A 55 month, or 4 year and 7 month low.
Townhouse Benchmark Pricing:
- August: $917,900
- September: $913,800
- October: $884,300
- November: $893,500
- December: $882,800
- January: $870,000
- February: $864,500
- March: $902,700
- April: $896,900
- May: $885,600
- June: $877,300
- July: $853,300
•••
Condo Market Overview:
- Before taking a positive step forward in March, which set a benchmark high for 2026, six of the last nine months had marked new low points for the condo market.
- The benchmark price is now $26,500 below 2026 benchmark high.
- The benchmark has now decreased ten of the last 13 months.
- May’s benchmark is $47,700 lower than June 2025. A 7.7% dip.
- Between February & April supply increased by 58. Since April supply has decreased by 26.
- After increasing for 5 consecutive months sales decreased in July.
- Relatively speaking supply is heading in a healthy direction and sales remain active. Days on market continue to fluctuate, but remain lower than early spring. All positive indicators that are ticking in the right direction at the cost of a reduced benchmark price.
- July is now the 11th straight month with a sub 600k benchmark.
- The last time the benchmark was below 600k for more than a single month was prior to it ever breaking 600k in the first place back in March 2022.
- The benchmark now sits between February and January 2022. $9,200 above Jan 2022 roughly a 54 month low.
Summary:
Port Coquitlam’s market lost momentum in July after June’s brief recovery. Benchmark prices fell across all three segments, sales declined in two, and days on market increased across two-thirds of the market. Supply has eased slightly but remains elevated.
Detached homes remain the weakest segment. July’s $1,308,500 benchmark is a new 39-month low, returning prices to spring 2023 levels. The benchmark has fallen sharply since March, with only a minor June reprieve. There are now 120 more active listings than when prices were last this low, while sales remain weak.
Townhouses have experienced the largest price correction. July’s $853,300 benchmark is $49,400 below March’s peak and just $3,300 above December 2021 pricing. Prices are down 9.5% year over year, or $89,800. Supply has improved and sales remain steady but rising days on market continue to point toward buyer leverage.
Condos are showing some healthier underlying indicators despite continued price pressure. The benchmark remains below $600,000 for an 11th consecutive month and is roughly at a 54-month low. However, supply has fallen by 26 listings since April, while days on market remain below early-spring levels.
Overall, July reinforced that Port Coquitlam remains in a price-correction phase rather than a recovery. Detached and condo sales are both down 40% year over year, while townhouse sales are unchanged. Buyers continue to have considerable choice and leverage, with sellers still waiting for a more durable market bottom.
Our Google reviews will give you all the confidence you need!
TOP 5 reasons to work with R3 Hayes Real Estate Group

In a market full of noise and hesitation, we’re the steady hand you can trust.
Whether you’re planning ahead or ready to make a move, let’s talk strategy—we’re here to help you come out ahead.

R3 Hayes Real Estate Group – Your Neighbourhood Experts
Call/Text Ryan: 604-561-2127
Follow us on social media for more market updates!