Port Coquitlam Market:
October 2026 vs 2025
October seeks to find balance after a rough couple of months
For 2/3 of the market October may be the beginning of a balancing point
Looking for an accurate picture of where the real estate market is headed?
Today we dive in and take a deeper look at the Port Coquitlam market as a whole:
- A full overview & an in depth look at detached homes, townhouses, & condos focusing on:
- How statistics stack up to the previous month’s activity.
- Where we are standing compared to the same time period in 2025.
- Larger market trends.

•••
Port Coquitlam Benchmark Price Overview:
- Townhouse: We are now past the one year mark of a sub-900k benchmark. This is now the new normal. After sitting under 850k for two months the benchmark surged in October. Increasing over $20,000 in a single month the benchmark has now returned to July levels. With lower supply, more sales, and fewer average days on market perhaps the benchmark is finally finding its balance.
- Detached: Seven of the last ten months have seen prices trend downwards and we now sit $3,100 above the June 2021 benchmark officially erasing much of the historic gains seen in late 2021 through spring 2022.
- Condo: For half a year the benchmark bounced back and forth keeping everyone on their toes and from June through to September it took a fairly large decline. Now, October hints at balance planted firmly in 2021 (pre-boom) pricing. After spending four years above 600k that no longer appears to be a reality. However, like townhouses, October showed encouraging signs of stabilization.
Port Coquitlam Market Snapshot (a review):
- Over the last six months the real estate market in Poco has developed as follows:
- May marks the second straight month of unanimous benchmark price decline. Supply is up everywhere aside from condos, sales remain relatively strong, & days on market improve aside from detached. The detached market, at least month-over-month, is putting forward the weakest performance.
- Purely looking at the benchmark June was one of 2026’s strongest months as all three segments of the market increased. Supply decreased for the attached side of the market, but days on mark increased across the board.
- July was a rough one with sizable benchmark decreases for all three segments of the market. Sales decreased for 2/3 of the market as days on market increased for 2/3.
- The benchmark price took a big hit in August, especially for detached homes. However, sales maintained and days on market came down for 2/3 of the market. Supply decreased across the board. All-in-all outside of price it was a fairly active month.
- Benchmark prices continued on a fairly strong downward trajectory in September, especially townhouses which are now edging closer to an 800k threshold. Days on market increased for 2/3 of the market, while sales maintained for 2/3. Supply increase for attached homes. Despite not seeing the largest benchmark decline the condo sector took the hardest hit in September with sales halved and days on market nearly doubling and supply balloons further.
- After a rough September October brought signs of a true shift. Average days on market and supply decreased across the board. The attached market was especially positive as both skews saw increased sales and an increased benchmark. Detached homes were the only areas to continue to trend downwards with a lower benchmark and fewer sales.
Year-over-year Comparison:
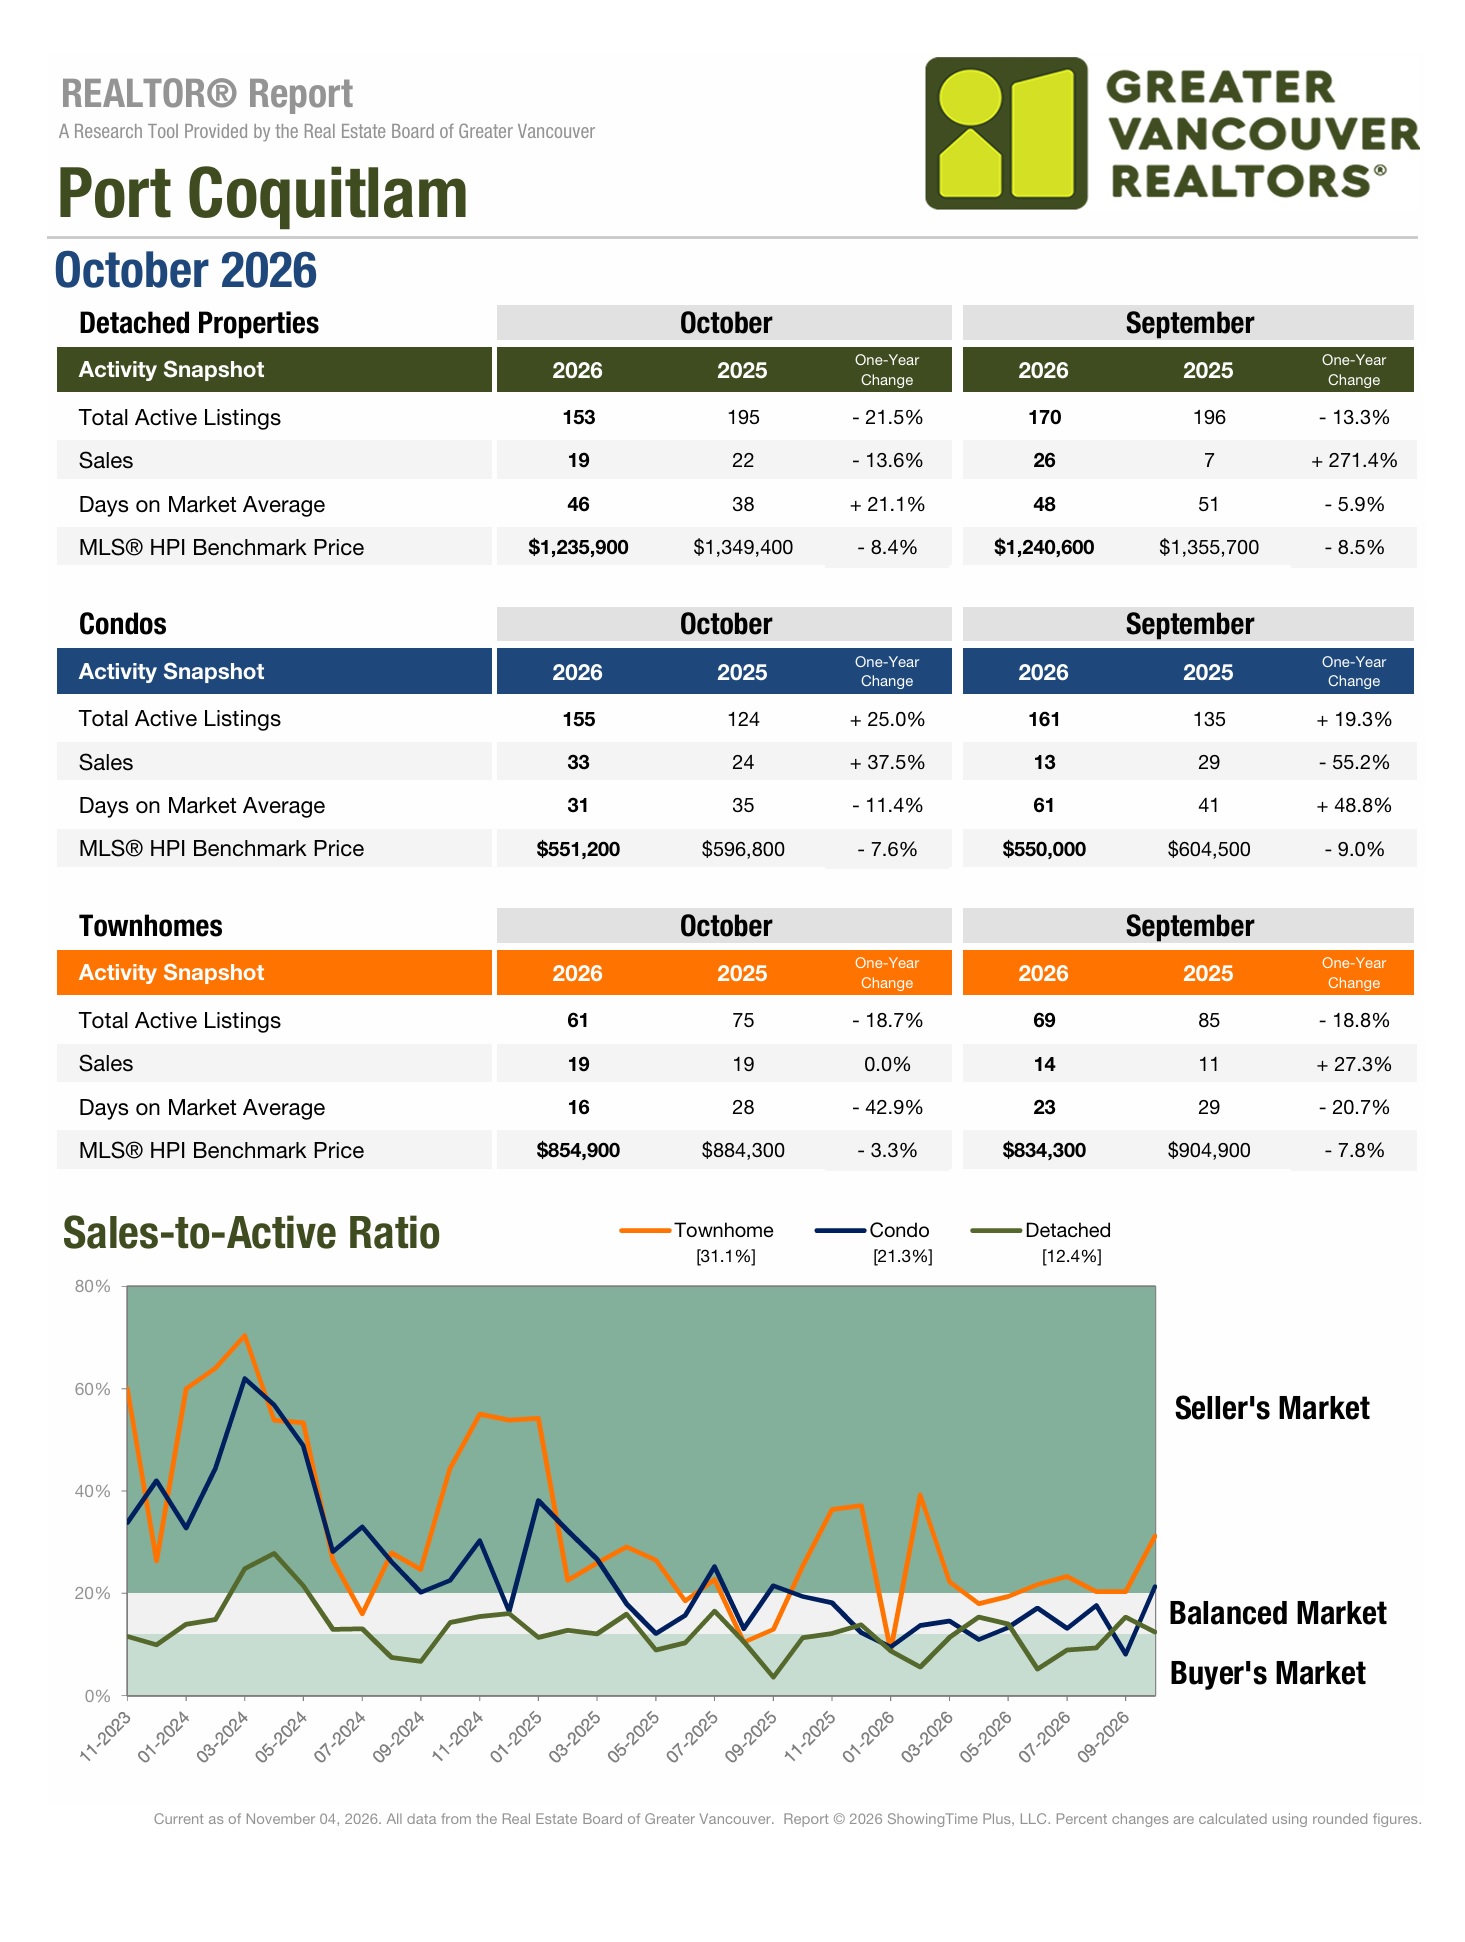
- Year-over- year detached homes face a largely unfavourable comparison. With continued monthly decreases supply is well October 2025, although it remains historically high. Days on market are up by over 21% year-over-year, & the benchmark price is down 8.5% (-$113,500). Sales slowed in October compared to September and saw a 13.6% dip compared to October 2025.
- The townhouse market is largely netting positive compared to October 2025. Supply is down by nearly 19% & sales remain on par with last year. Days on market are down nearly 43%, and while prices are still down $29,400 compared to October 2025 the year-over-year gap is narrowing dramatically as October 2025 was the beginning of the current downturn which may be leveling.
- The condo market is a mixed bag. Active listings are up 25% but sales are up 37.5%. Year-over-year days on market have decreased 11.4%, while the benchmark has decreased 7.6% (down $45,600). However like with townhouses the percentage gap between 2026 and 2025 benchmark is narrowing.
Overall Supply & Sales Update:
Compared to the same time last year supply is mixed:
- Detached: -21.5%
- Condo: +25%
- Townhouse: -18.7%
Supply is down when October is compared to September:
- Detached: 17 less listings than in September
- Condo: 6 less listings than in September
- Townhouse: 8 less listings than in September
Compared to the same time last year sales vary:
- Detached: -13.6%
- Condo: -37.5%
- Townhouse: 0.0%
Sales vary month over month (compared to September):
- Detached: 7 less sales than September
- Condo: 20 more sales than September
- Townhouse: 5 more sale than September

•••
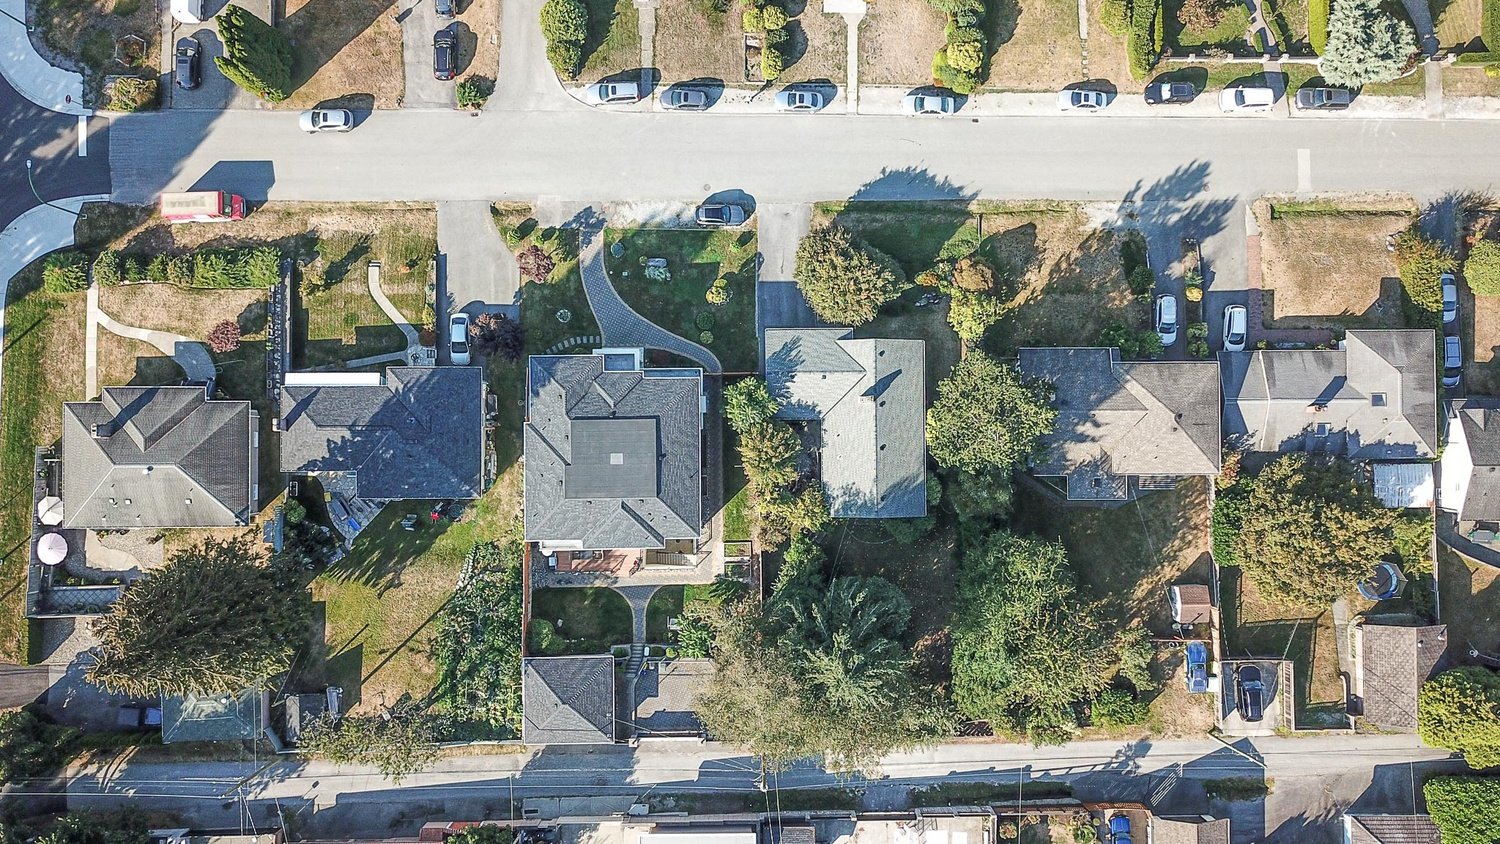
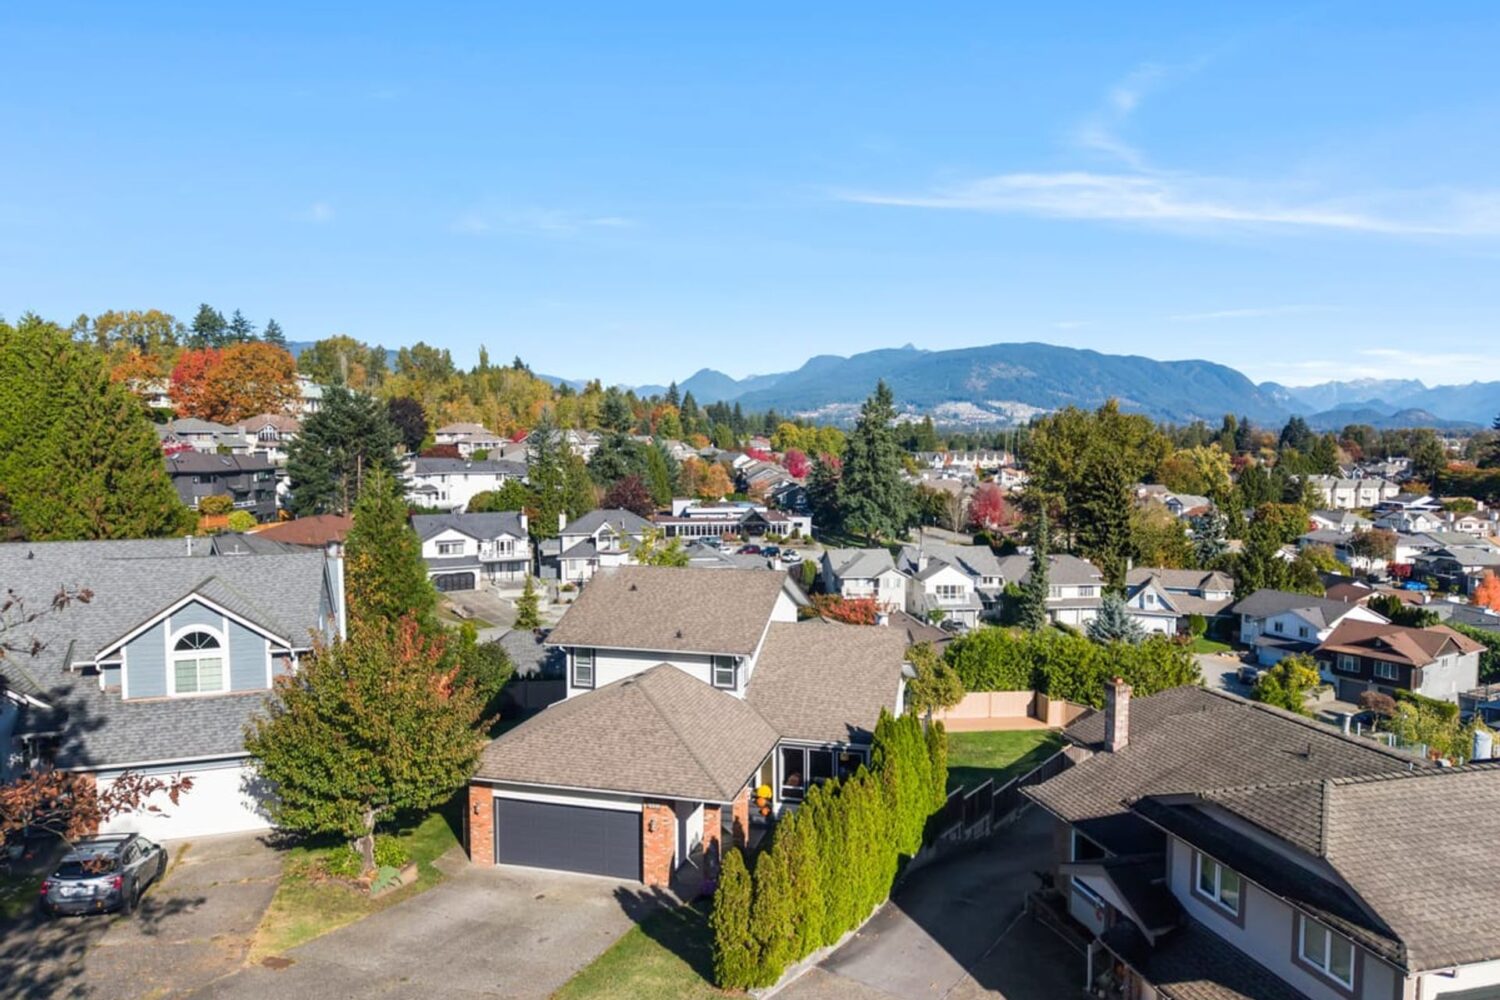
Detached Market Update:
- October 2026 vs 2025 saw the detached benchmark price decrease by $113,500.
- We are now butting up against the beginning of the current downturn which started in late 2025.
- After August’s colossal $64,700 30-day benchmark drop September & October did not see any recovery. This stands at odds with the attached markets which both saw an increase in October.
- Instead September experienced a $3,200 decrease over August’s numbers. And October saw a further decrease of $4,700
- The benchmark is now just $3,100 above June 2021. A new 5 year and four month low.
- One of the market’s main issues remains high supply.
- Although supply has now come down four months in a row, and that is positive, there were only 112 active listings in June 2021 when the benchmark was last at this level. Which means the current supply is still 36% higher.
- One bright spot is the number of sales. October slowed slightly but remained busy after September tied April as the year’s busiest month for sales. Combined the last four months have been busier than the majority of 2026.
- Days on market are down, sales remain relatively strong, and supply is routinely dropping which are all positive signs that we are heading towards a balanced market. But the benchmark continues to dip. The main question remains, how far will the benchmark have to drop in order to truly bring balance back to the detached market? We are certainly the closest we have been in 2026…and if we continue along the current path it shouldn’t be much longer.
Detached Home Benchmark Pricing:
- November: $1,358,700
- December: $1,343,000
- January: $1,340,100
- February: $1,347,000
- March: $1,351,300
- April: $1,326,700
- May: $1,320,700
- June: $1,322,600
- July: $1,308,500
- August: $1,243,800
- September: $1,240,600
- October: $1,235,900
•••
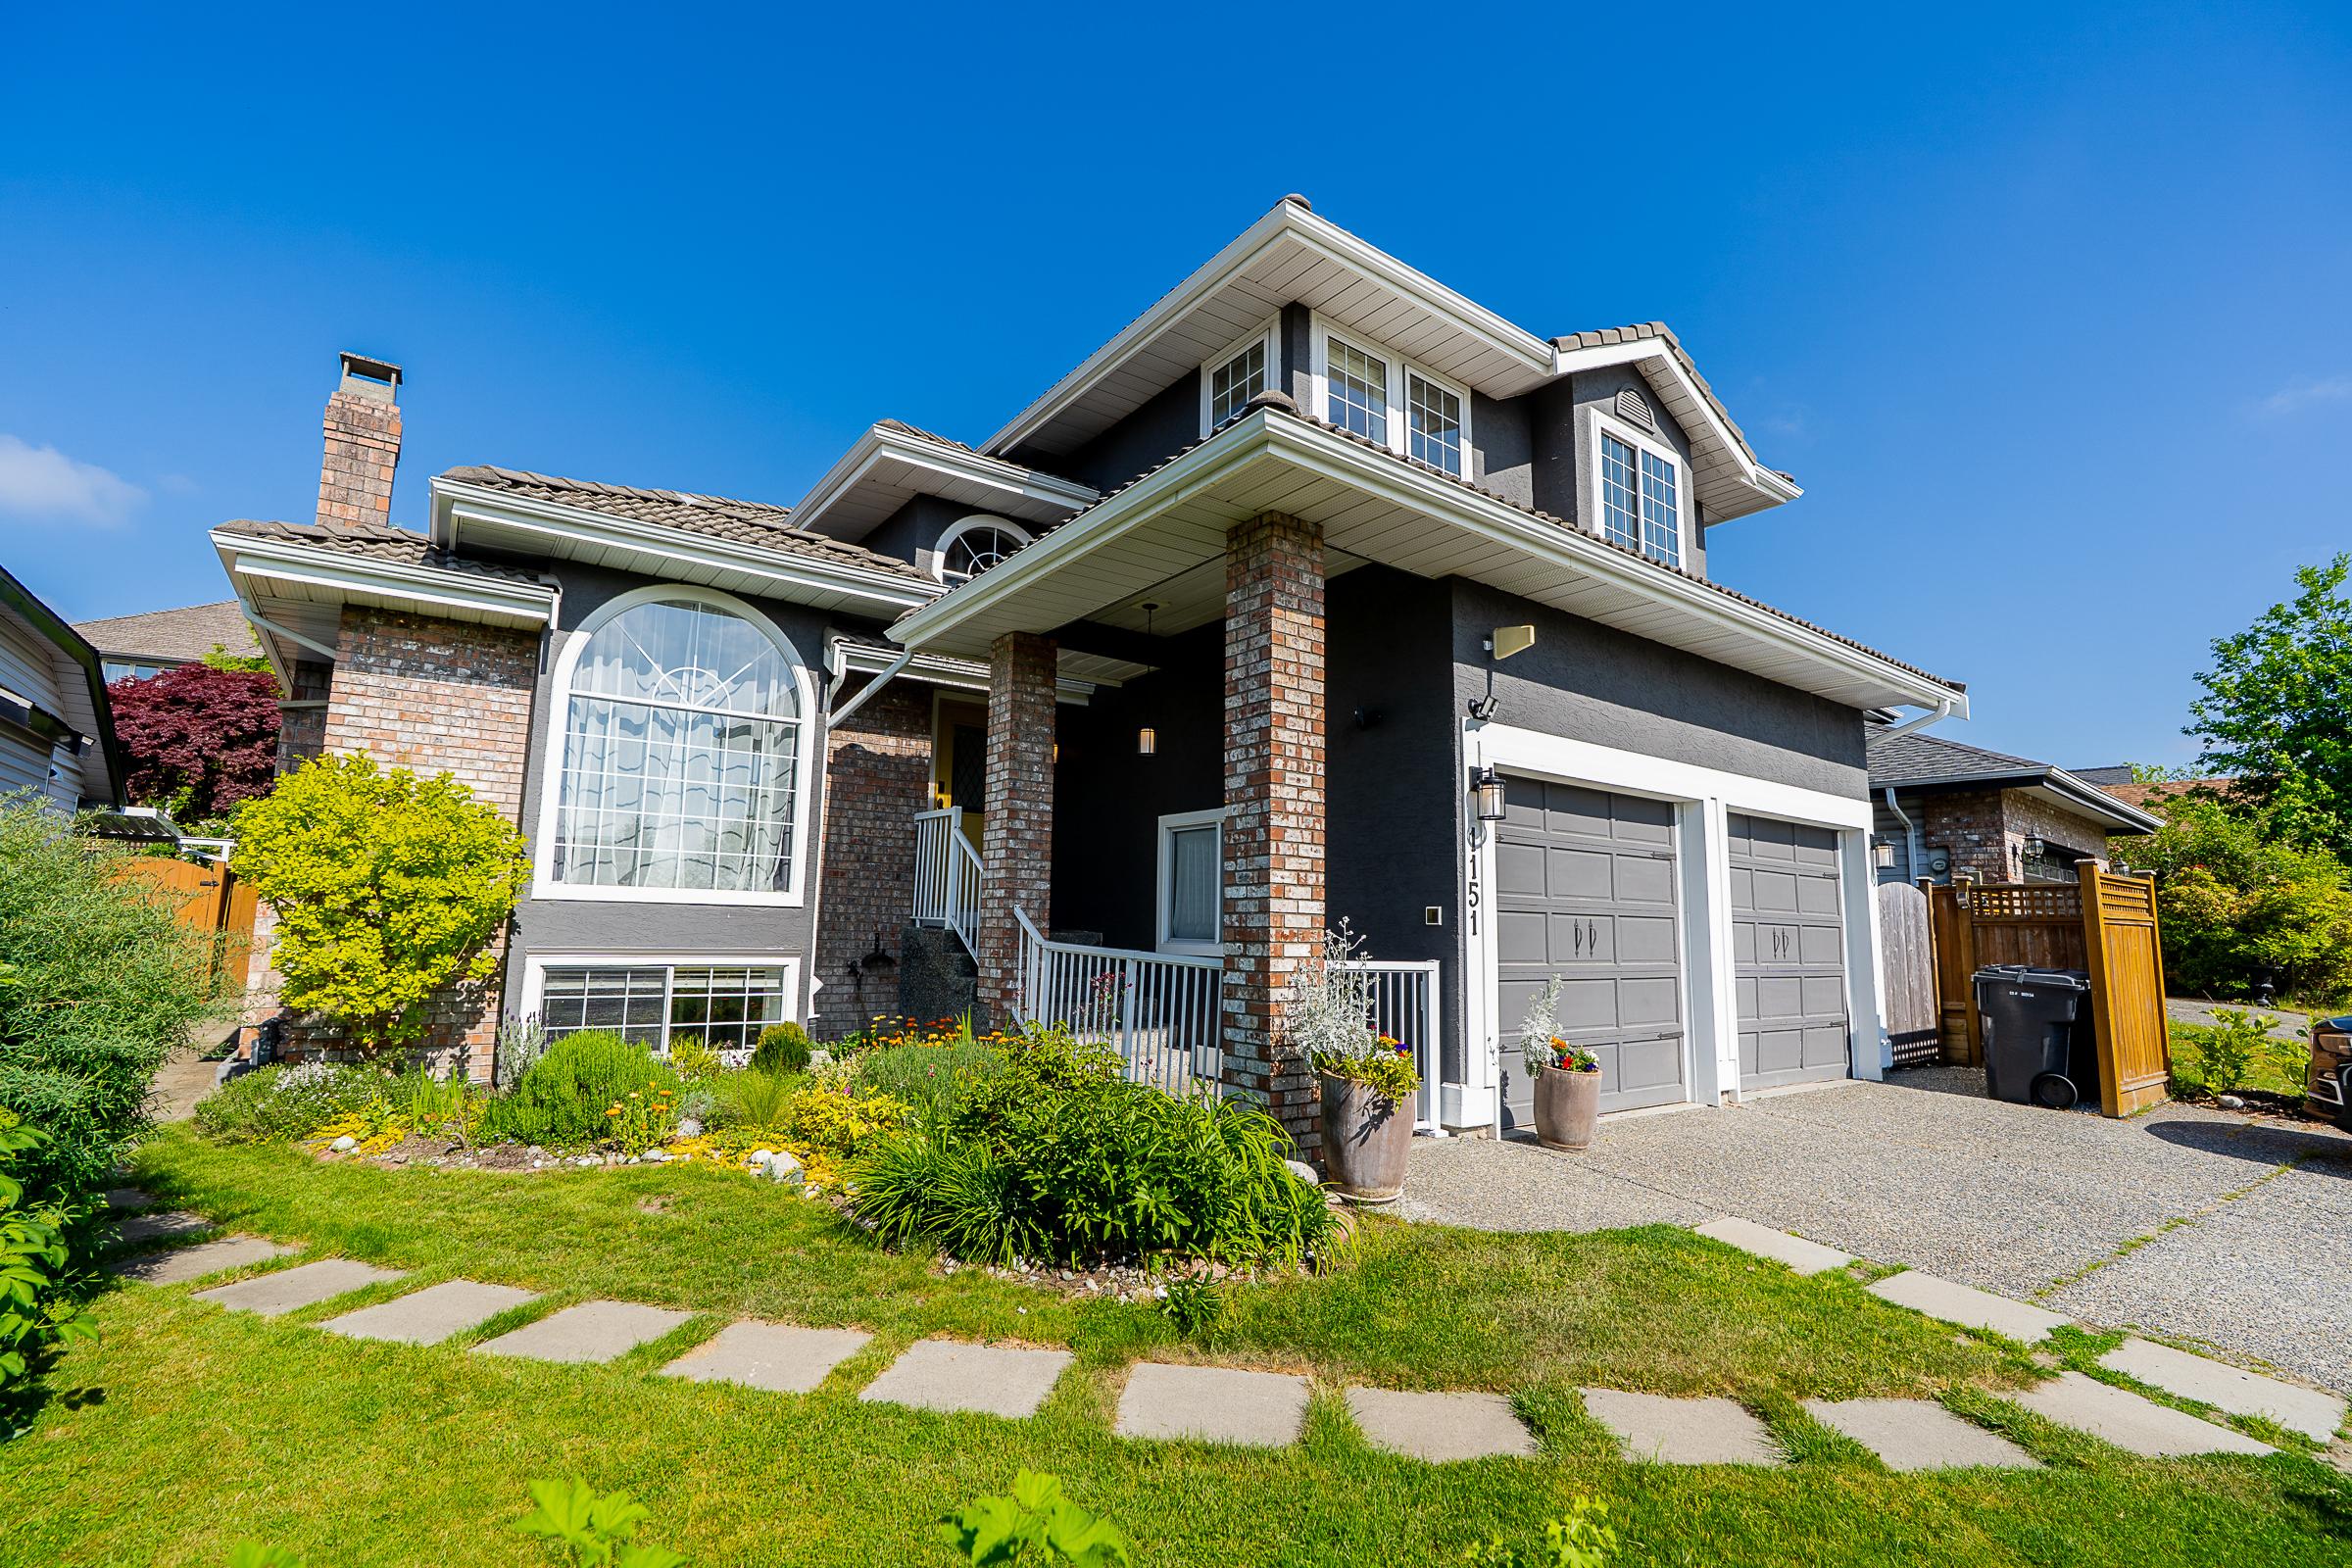
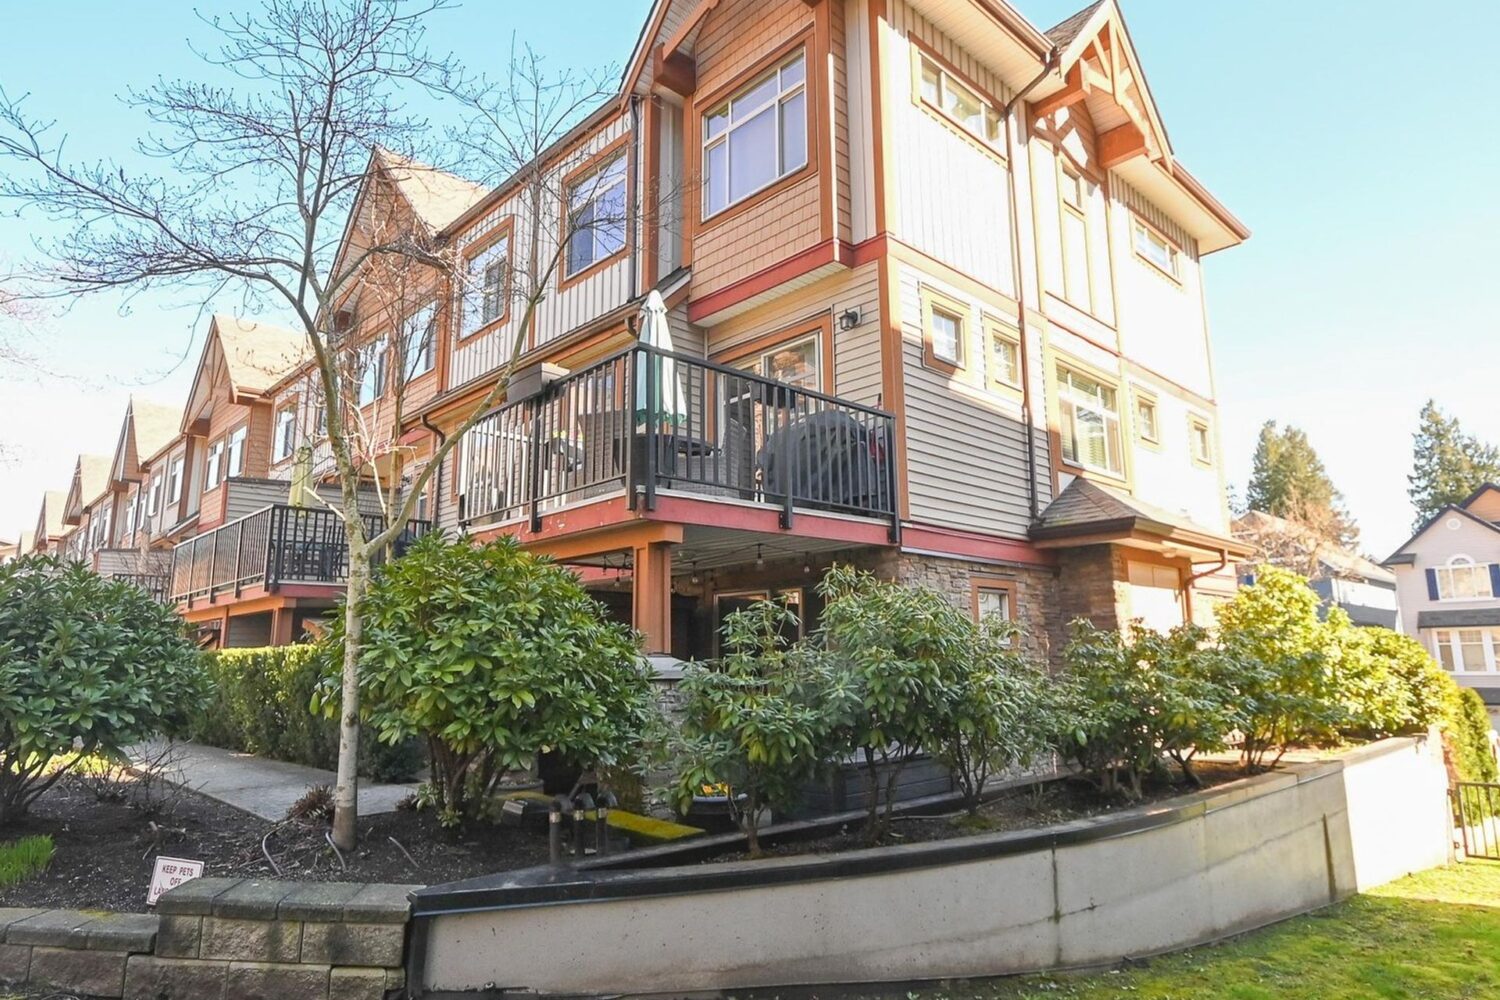
Townhouse Market Update:
- This year the townhouse market experienced an early benchmark peak in March before dropping $68,400; an average decrease of $11,400 a month for 6 months straight. But October but an abrupt pause on the decline.
- October was the first benchmark increase in six months and only the second benchmark increase in the last year. Jumping up $20,600 in just 30-days it was sizable shift pushing back against an established trajectory.
- Main question now is whether this increase was a one off as it was in March or a true indicator of a more balanced market.
- After seeing a slight uptick in September supply has once again decreased. Supply has now decreased for 4 of the last 6 months.
- September saw supply increase by 4 and October saw a decrease of 8.
- Supply has decreased by over 40% compared to May when it was at 86.
- Since days on market peeked in August at 39 they have come down roughly 240% now averaging 23 less days on market.
- October brought days on market down to their lowest position of the year. And only the second time they dipped below 20.
- The benchmark price is only 3.3% below October 2025. Again, the gap is closing as pricing decreases were already under way in October of last year.
- Despite the benchmark increase townhouses remain just $4,600 above December 2021 pricing. Just as it was in September we prices remain at a 4 year and 10 month low.
- The current market situation remains a part of a much larger correction to re-balance prices prior to 2022’s all-time peak where the benchmark increased from a low of ~660k at the start of 2021 to a high of over $1,031,000 in late spring 2022. An increase of roughly $371,000 in a year that never should have naturally occurred.
- The main hope now is that we beginning to see a levelling and settle in to a full new normal where both buyers and sellers can feel comfortable and not fear prices will wildly change.
Townhouse Benchmark Pricing:
- November: $893,500
- December: $882,800
- January: $870,000
- February: $864,500
- March: $902,700
- April: $896,900
- May: $885,600
- June: $877,300
- July: $853,300
- August: $847,200
- September: $834,300
- October: $854,900
•••
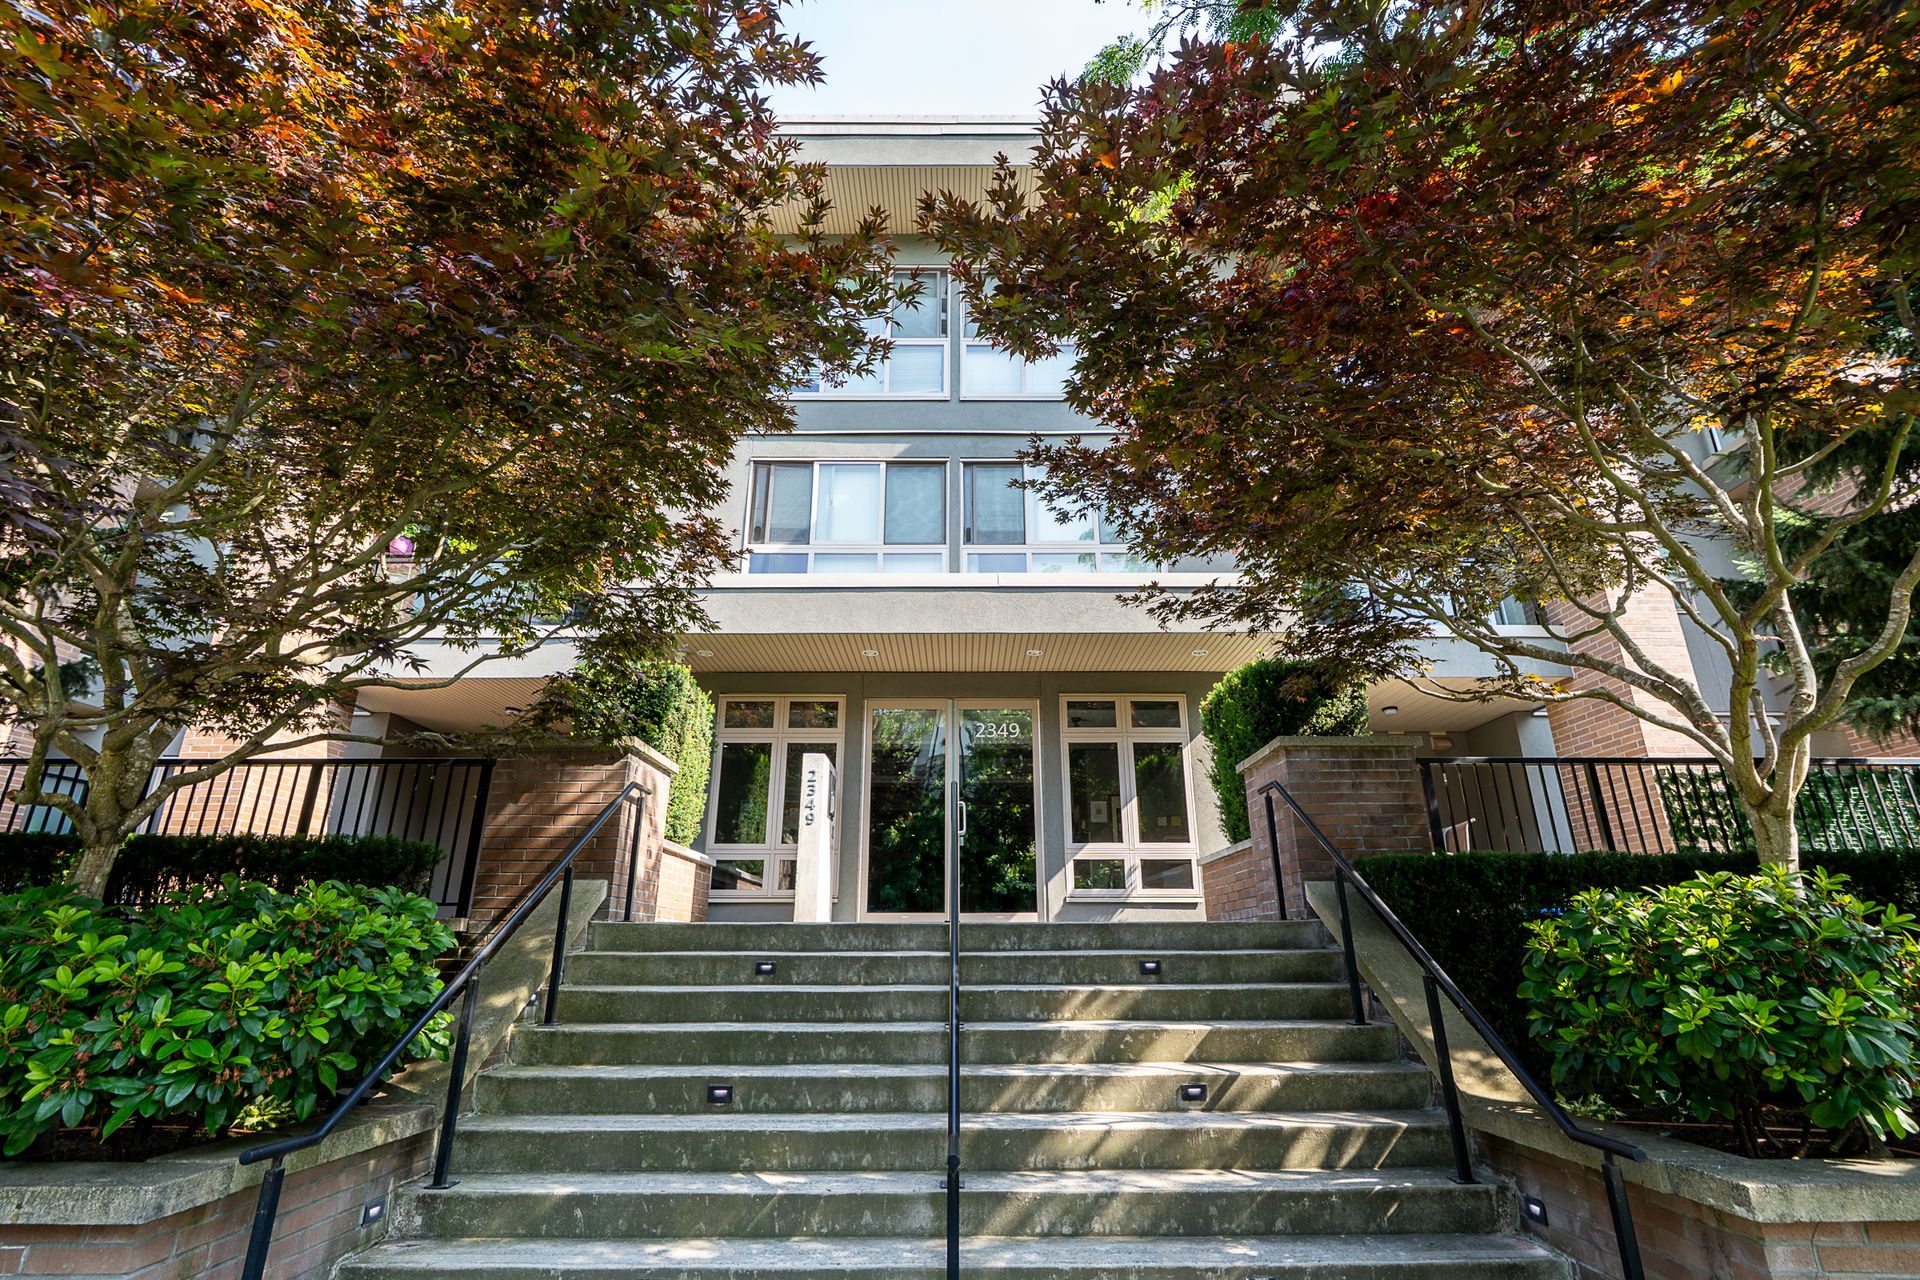
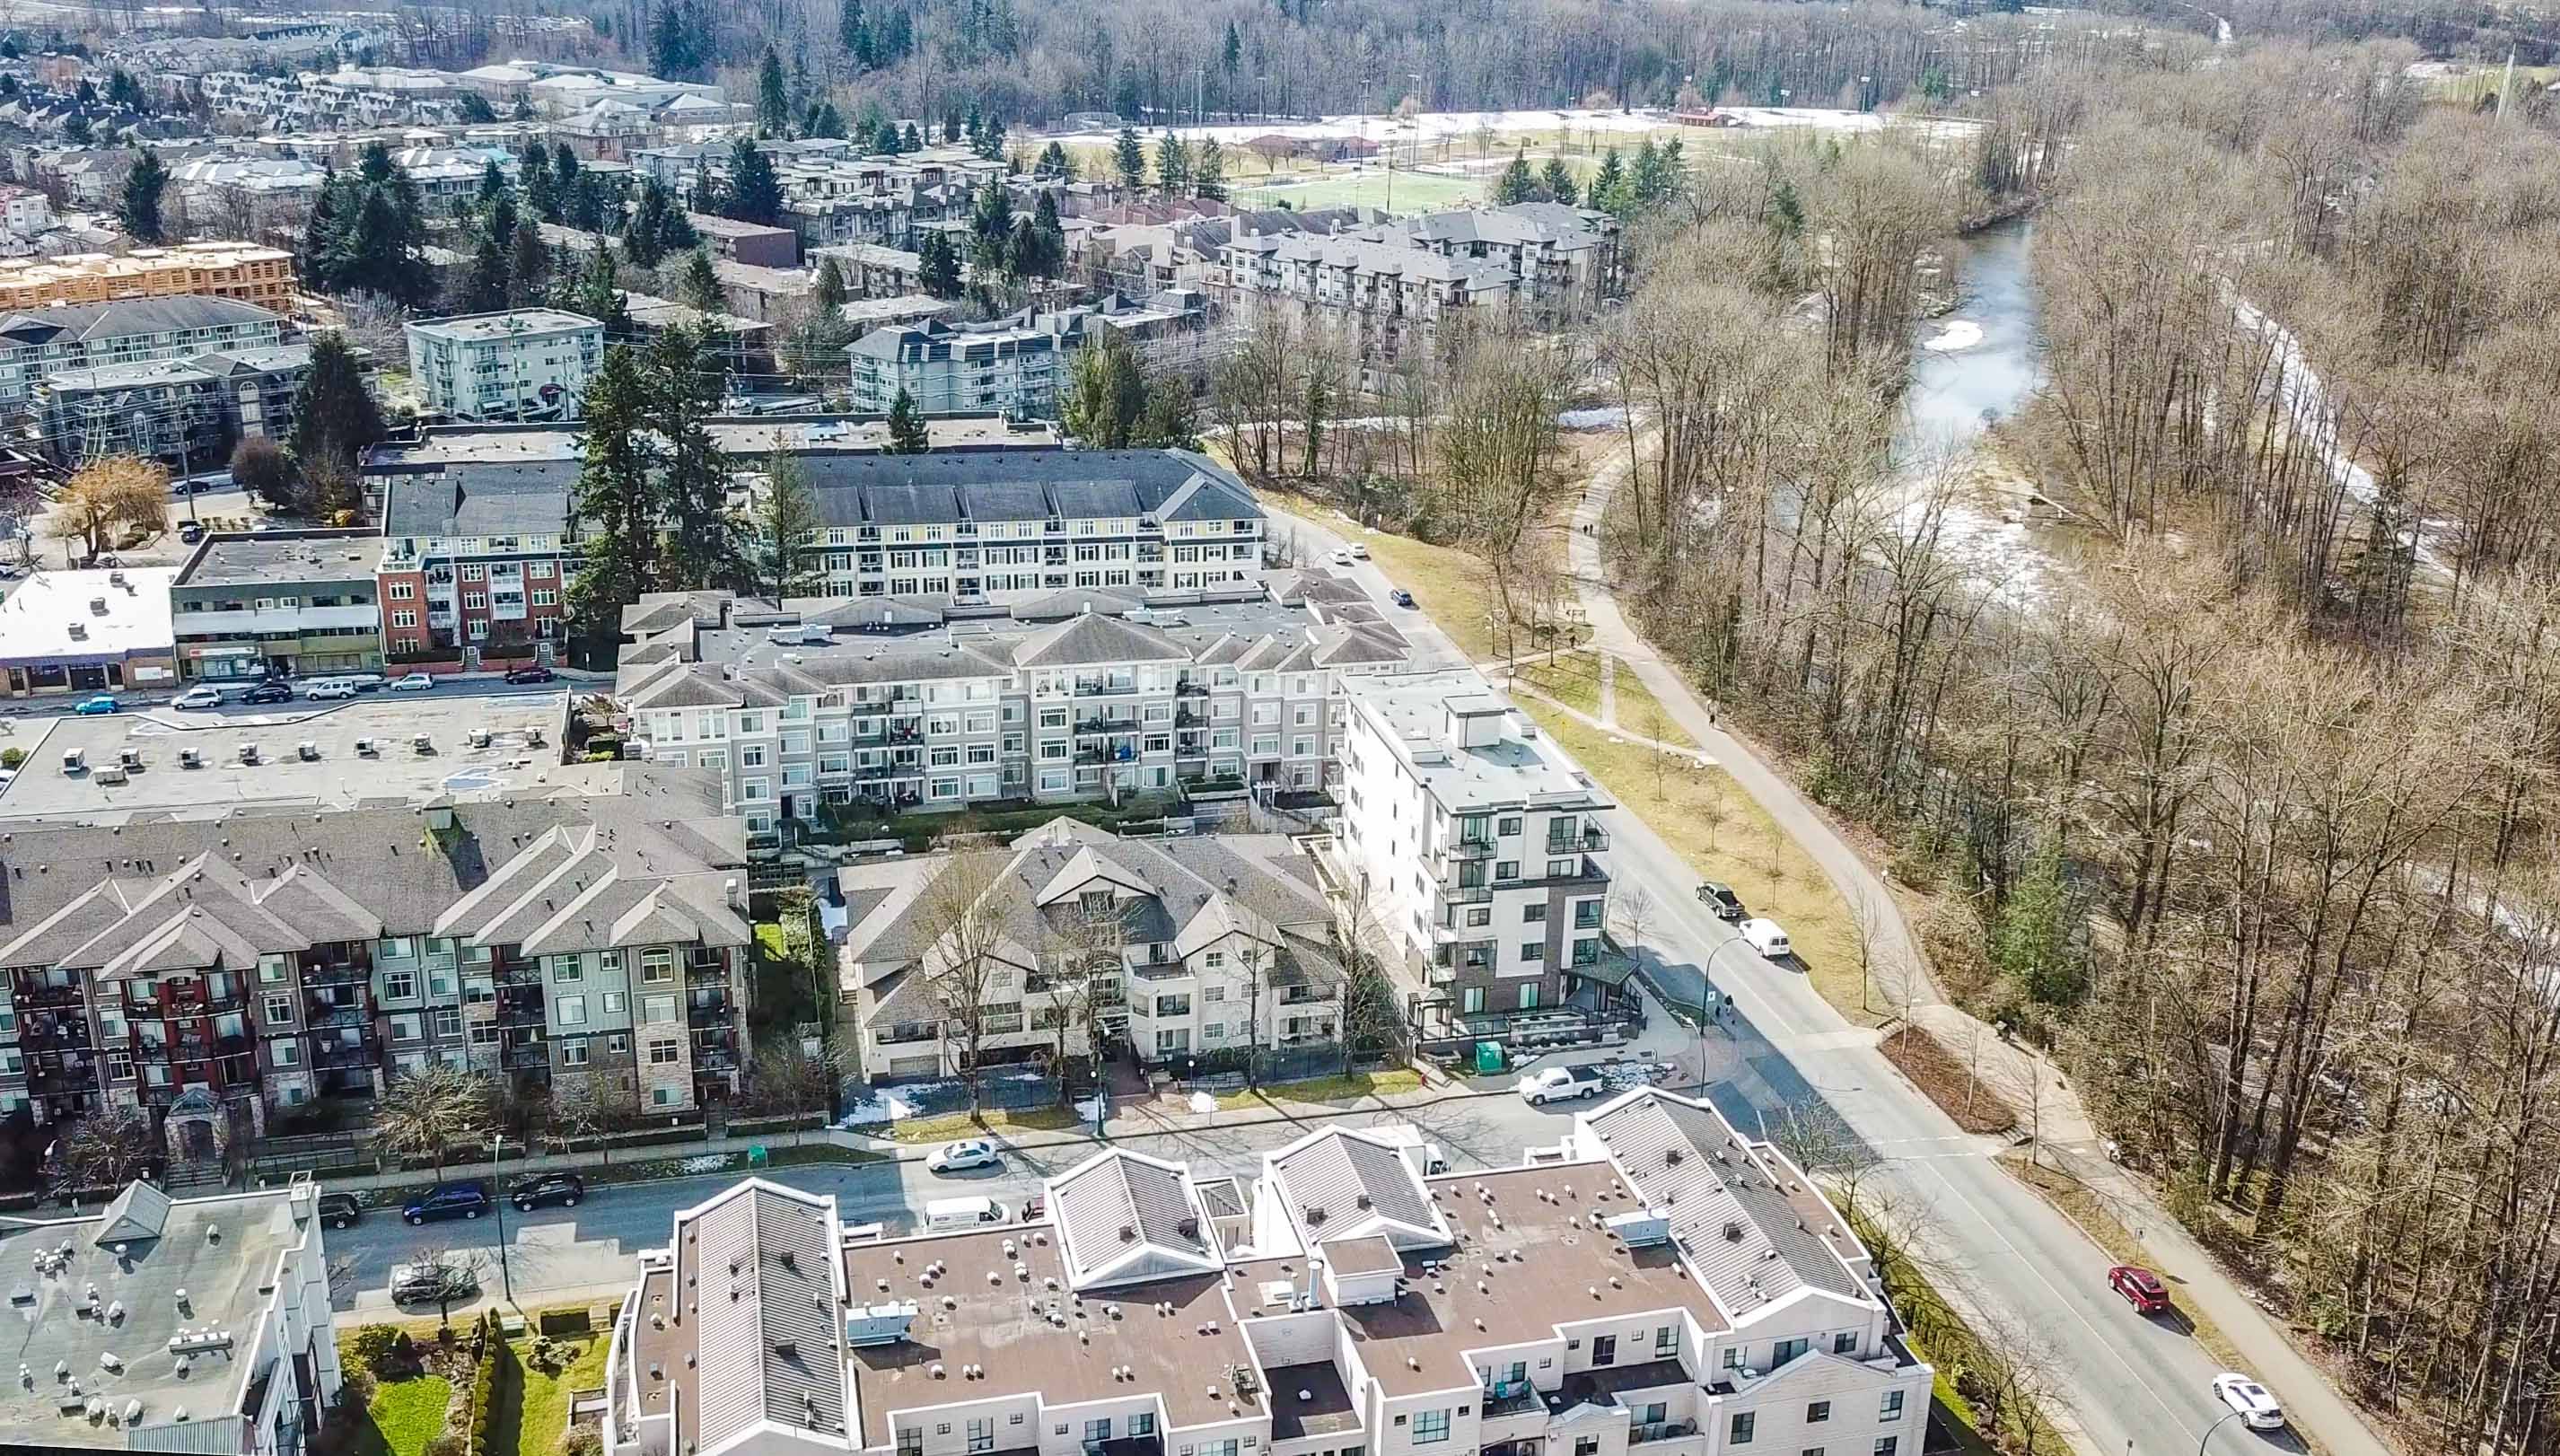
Condo Market Overview:
- After March set a benchmark high for 2026 there was six months of decline before October pushed the pause button with a $1,200 30-day increase.
- Nonetheless the benchmark price is still $46,000 below 2026 benchmark high. A 7.7% dip in just 7 months.
- While October is a welcome reprieve the benchmark has still decreased twelve of the last sixteen months.
- October’s benchmark is $45,600 lower than October 2025. A 7.6% dip.
- Supply has varied in 2026:
- Between February & April supply increased by 58.
- Between April & August supply decreased by 44 nearly erasing the early spring burst.
- September saw a 30 day supply increase of 15 listings and October saw a decrease of 6.
- Ultimately supply remains high. The most surplus of all three pillars in the Port Coquitlam market.
- For most of 2026 sales have been bolstered by declining prices:
- Since February only July & September saw declining sales.
- October more than bounced back with just shy of a 260% increase over September.
- September was truly a dark spot on the condo market but October has shown it to be a one off with every metric increasing positively month over month.
- All of this being said, October marks 14 months of a sub 600k benchmarks.
- The last time the benchmark was below 600k for more than a single month was prior to it ever breaking 600k in the first place back in March 2022. At this point in time a 600k return should no longer be expected.
- The benchmark is just $1,200 above December 2021, a 58 month low.
While benchmark prices remains rooted in 2021 for a third month, both townhouses and condos showed multiple meaningful improvements in October while the detached market continued to struggle.
Summary:
October brought a welcome shift to Port Coquitlam’s housing market, marking a significant improvement over a particularly difficult September. While benchmark prices remain firmly rooted in 2021 levels, the downward momentum finally eased in two of the three housing segments. Townhouses and condos posted price increases alongside stronger sales, declining inventory, and shorter marketing times. Detached homes continued to face pricing pressure, but showed encouraging signs beneath the surface. The question heading into the final months of 2026 is whether October marks the beginning of a more sustained market recovery.
Detached homes remained the outlier, with the benchmark falling another $4,700 to $1,235,900, just $3,100 above June 2021 and down 8.5% year-over-year. Sales dipped by seven from September but remained relatively healthy. Encouragingly, supply declined for the fourth consecutive month and days on market improved. Although inventory remains 36% above comparable 2021 levels, these trends suggest the market is moving closer to balance.
Townhouses delivered October’s strongest performance. After six consecutive declines totalling $68,400, the benchmark rebounded $20,600 to $854,900, its first increase since March. Sales rose by five, inventory fell by eight, and days on market reached a 2026 low. With supply down over 40% from May and prices just 3.3% below last October, signs of stabilization are growing.
Condos rebounded sharply from September. Sales climbed by 20, inventory fell by six, and days on market improved. The benchmark rose $1,200, ending six consecutive monthly declines, although prices remain 7.6% below October 2025 and near December 2021 levels. With the benchmark below $600,000 for 14 consecutive months, stronger sales suggest buyers may finally be responding to improved affordability.
For the third consecutive month, all three segments remained near 2021 pricing, but October delivered the clearest progress in months. Townhouses showed signs of stabilization, condos regained momentum, and supply declined across the board. Even detached homes improved on several underlying measures. While one month cannot establish a lasting trend, October marked a meaningful step toward balance. Maintaining that momentum will be key as 2026 draws to a close.
Our Google reviews will give you all the confidence you need!
TOP 5 reasons to work with R3 Hayes Real Estate Group

In a market full of noise and hesitation, we’re the steady hand you can trust.
Whether you’re planning ahead or ready to make a move, let’s talk strategy—we’re here to help you come out ahead.

R3 Hayes Real Estate Group – Your Neighbourhood Experts
Call/Text Ryan: 604-561-2127
Follow us on social media for more market updates!