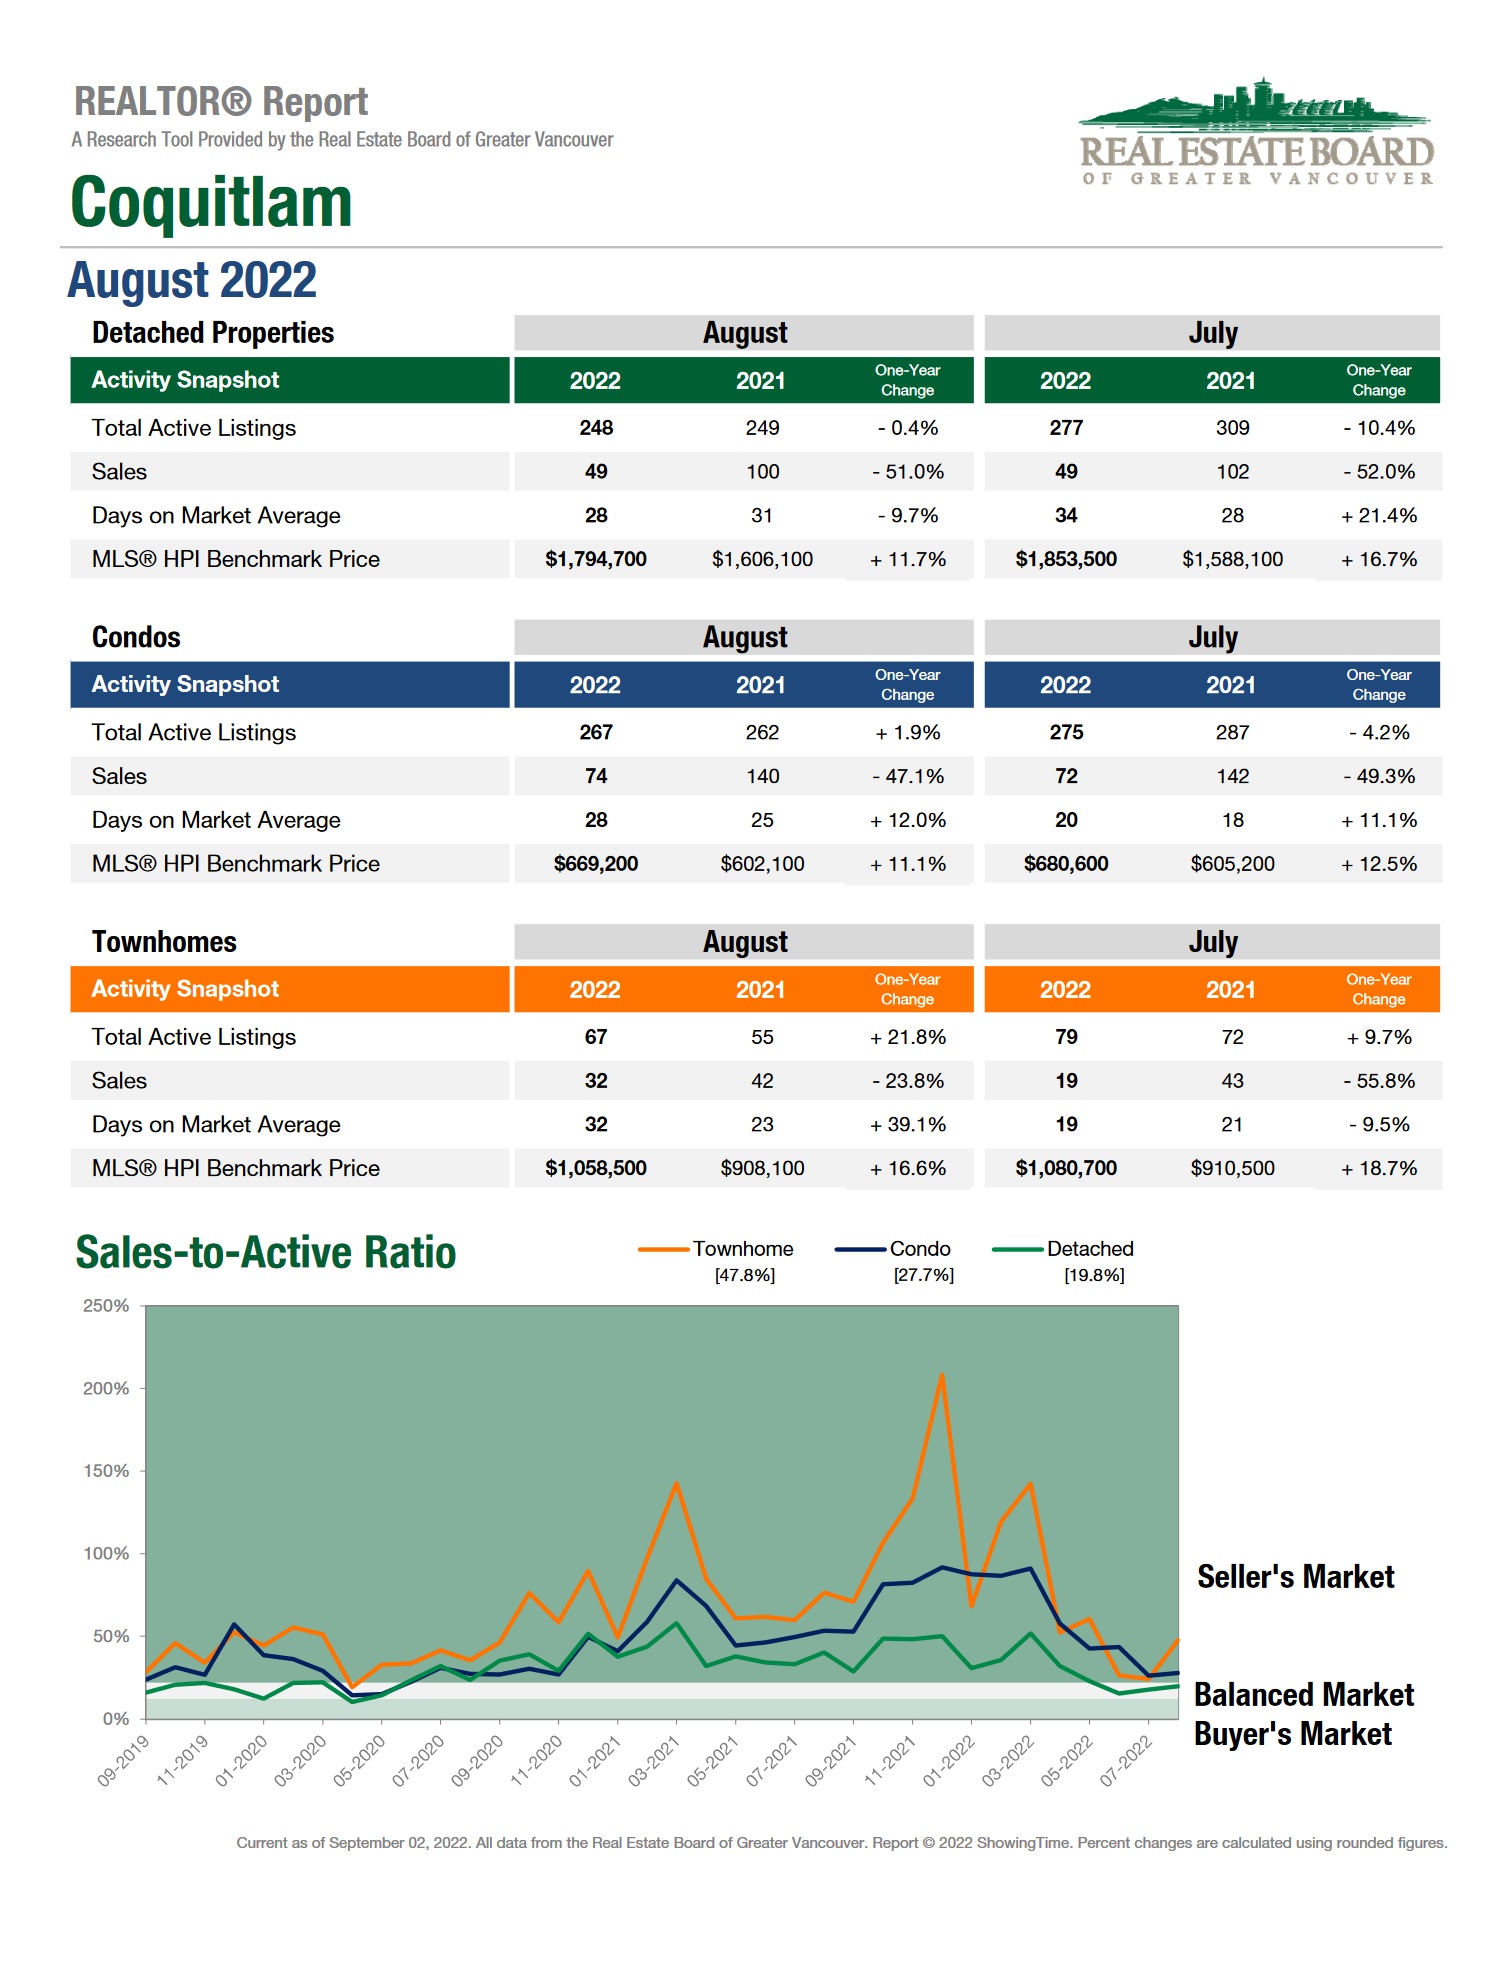
Benchmark prices are up across the board, between 11.1%-16.6% over thier 2021 counterparts.
Detached Market:
The June benchmark for detached homes was $188,600 higher than its 2021 counterpart.
August marks the fourth consecutive month that detached home's benchmark pricing has dropped.
Following the rest of the Tri City area August's pricing decline has once again increased its rate after slowing in July.
It decreased a substantial $58,800 in the last 30-days;
a decrease of $38,200 more than the previous month.


April: $1,961,800
May: $1,950,800
June: $1,874,100
July: $1,853,500
August: $1,794,700

Supply:
In August detached homes saw 29 less listings than July 2022, and only a 0.4% decrease over the same time last year.
Condos saw 8 fewer listings than July 2022, and a 1.9% supply increase over August 2021.
Townhouses saw 12 fewer listings than July 2022. However, supply is up 21.8% compared to August 2021.
Sales:

Across the board sales saw a massive decrease compared to August 2021 and an increase compared to July 2022.
Compared to the same time last year sales are down between 23.8%-51%
Detached homes had the same amount of sales as July 2022
Townhomes sold 2 more units than July 2022 and condos sold 13 more.
Townhouse Market:
Townhouse benchmark prices drcreased for the fourth consecutive month.
Townhouse benchmark pricing is down $22,200 in the last 30 days,

April: $1,149,300
May: $1,121,400
June: $1,086,500
July: $1,080,700
August: $ 1,058,500

Townhouse benchmark pricing is $150,400 higher than the same time in 2021.
SNAPSHOT:

Fluctuating Sales. Decreasing Prices. Buyer's Market.