Port Coquitlam Market:
February 2025 vs 2024

2025 remains cautious...
Overall steady, with optimistic signs!
Looking for an accurate picture of where the real estate market is headed?
Today we dive in and take a deeper look at the Port Coquitlam market as a whole:
- A full overview & an in depth look at detached homes and townhouses. Both focusing on:
- How statistics stack up to the previous month's activity.
- Where we are standing compared to the same time period in 2024.
- Larger market trends.

•••
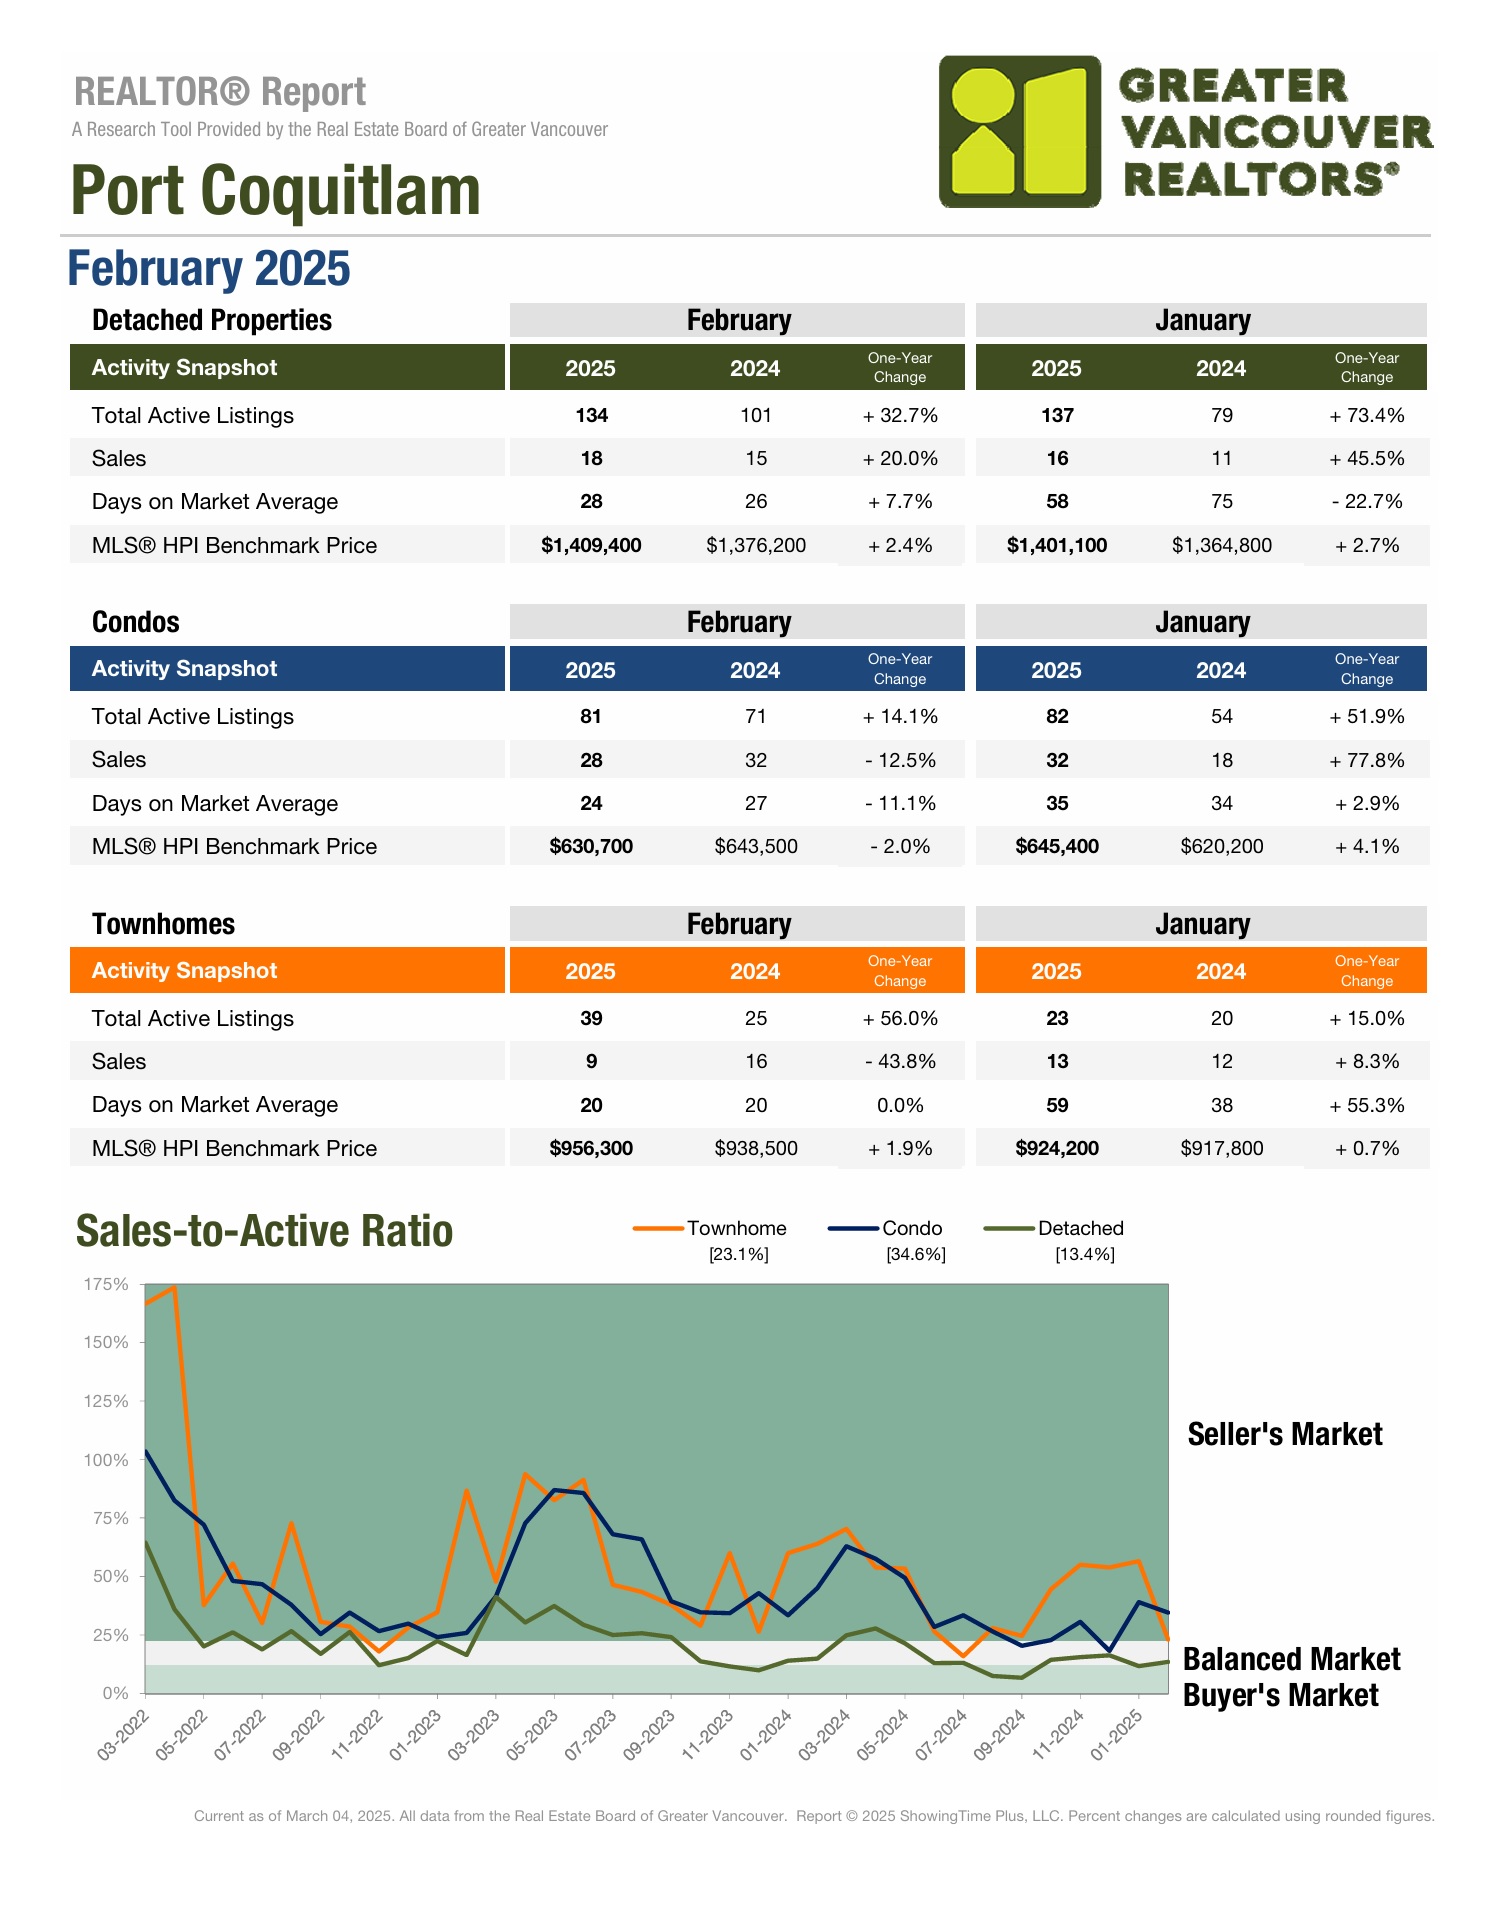
Port Coquitlam Benchmark Price Overview:
- After taking a big pricing cut in October townhouses rebounded. Aside from January they have seen the largest market gains of all three segments of housing over the last six months.
- Directly after hitting a new 2024 benchmark high in October detached homes plunged downwards in November before beginning to crawl back up in the first two months of 2025...the benchmark is still roughly $50,000 below October 2024.
- After two month of benchmark pricing increases condos took a hit in February dipping below the previous year's benchmark for the first time since June 2023. That being said the benchmark price has fluctuated in the same $20,000 window since mid 2024.
Port Coquitlam Market Snapshot (a review):
- Over the last six months the real estate market in Poco has developed as follows:
- September brought softening prices & continued slow sales.
- With the return of active buyers October saw a month-over-month supply decrease, increasing sales, & a new 2024 benchmark price for detached homes.
- November saw a third month in a row for supply decreases, stready sales, and a large drop off in the detached benchmark price.
- The year finished continually decreasing supply, a holiday sales slump, & increasing prices for attached homes.
- After two months of steep decline detached homes started 2025 with a price increase, condo sales shot up, & days on market took a large spike upwards.
- February saw a big jump in townhouse pricing, supply still well below Oct/Nov 2024 levels, large days on market decrease, & relatively low-but steady-sales.
2023-2024 Comparison:
- After 4 months of yo-yo pricing when compared to 2023 detached homes saw a sizable increase in October before bottoming out in Decemeber and beginning a slow recovery in 2025.
- $75,300 improvement October 2024 vs 2023.
- $24,700 improvement November 2024 vs 2023.
- $8,700 improvement December 2024 vs 2023.
- $36,300 improvement January 2025 vs 2024.
- $33,200 improvement February 2025 vs 2024.
- Last year townhouses never truly recovered after an early spring peak.
- October 2024 was a low point with the benchmark price dipping below $900,000 for the first time in 2024; the lowest benchmark since March 2023.
- November & December both saw improvement, but January 2025 was a large step backwards.
- February 2025 is the closet townhouses has been to their 2024 peak of $965,000 in April of last year.
- After peaking in February 2024 the condo market has really levelled off.
- Feb 2024 the benchmark price was $650,200.
- Since then lowest the benchmark price has fallen is $23,200 (November 2024)
- As of February 2025 the benchmark is $19,500 below the 2024 peak.
- For 12 months now pricing has continued to ebb and flow depending on the style of unit available and the number of buyers in the market. It remains the most steady pillar in the market.
Overall Supply & Sales Update:
Compared to the same time last year supply remains high:
- Detached: +32.7%
- Condo: +14.1%
- Townhouse: +56%
When February supply is compared to January:
- Detached: 3 less listings than in January
- Condo: 1 less listings than in January
- Townhouse: 16 more listings than in January
Compared to the same time last year sales for detached homes have increased, while attached have decreased:
- Detached: +20%
- Condo: -12.5%
- Townhomes: -43.8%
Sales varied month over month (compared to January):
- Detached: 2 more sales than January
- Condo: 4 less sales than January
- Townhouse: 4 less sales than January

•••
Detached Market Update:
A year in a nutshell:
2024 saw two pricing peaks five months apart. May-October 2024 yo-yo pricing ruled the market. Detached homes finished off 2024 on extremely rocky footing...but 2025 has shown signs of a controlled stabilization punctuated by slow growth.
- In the last 12 months detached home's benchmark pricing is up $33,200.
- October 2024 saw a the most substantial pricing increase in the last 12 months. $37,800 in 30-days.
- Over the last 5 months of 2024 the detached market saw four months of pricing decreases (in 2 month blocks) broken up by a single large increase.
- Pricing peak:
- We are now $47,500 below the 2024 peak.
- & $29,200 below the 2023 peak.
Detached Home Benchmark Pricing:
- March: $1,396,400
- April: $1,438,700
- May: $1,446,900
- June: $1,423,900
- July: $1,436,900
- August: $1,432,100
- September: $1,419,100
- October: $1,456,900
- November: $1,392,700
- December: $1,379,500
- January 2025: $1,401,100
- February: $1,409,400
•••
Townhouse Market Update:
- August experienced a brief uptick before September saw the largest 30 day movement, positive or negative, since mid 2022
- June - July 2022 saw a $65,300 decrease.
- August - September 2024 saw a $52,500 decrease.
- Following up such a sizable decrease, it was surprising the benchmark has dropped for the second consecutive month. As of October 2024 the benchmark price had dropped $69,800 in 60 days.
- However, in the four months following the market bottoming out townhouses have been in a positive place experiencing the strongest growth in the local market.
- Townhouses are now just $9,600 below the 2024 market peak.
- Year over year the benchmark price has increased $17,800. Major improvement as three of the last six months have seen the benchmark price below the previous year.
Townhouse Benchmark Pricing:
- March: $963,000
- April: $965,900
- May: $964,900
- June: $950,600
- July: $943,200
- August:$952,700
- September: $900,200
- October: $882,900
- November: $936,600
- December:$940,700
- January: $924,200
- February: $956,300
 The Port Coquitlam market is showing cautious optimism in early 2025. Detached homes are gradually recovering after a late 2024 drop, townhouses have nearly regained last year’s peak, and condos remain stable despite a slight dip in February. While pricing has fluctuated, townhouses have seen the strongest gains, bouncing back from a low point last fall.
Supply remains elevated compared to last year, with detached home listings up 32.7%, condos up 14.1%, and townhouses up 56%. Despite this, detached home sales have increased by 20%, indicating strong demand, while townhouses and condos have seen fewer transactions. Month over month, townhouse supply jumped in February, while detached and condo listings remained steady, reflecting shifting buyer priorities.
With detached homes stabilizing, townhouse prices climbing, and condos holding firm, the market is finding its footing. If these trends continue, 2025 could bring controlled growth, increased confidence, and a more balanced landscape for buyers and sellers alike.
Your Neighbourhood Experts
Have questions about Port Coquitlam's market? Click Here to CONTACT US

We are working to make your life easier.
