Port Coquitlam Market:
July 2025 vs 2024

Sales Rise. Prices Dip.
Supply continues to tighten for 2/3 of the market as sales increase month over month.
Looking for an accurate picture of where the real estate market is headed?
Today we dive in and take a deeper look at the Port Coquitlam market as a whole:
- A full overview & an in depth look at detached homes and townhouses. Both focusing on:
- How statistics stack up to the previous month's activity.
- Where we are standing compared to the same time period in 2024.
- Larger market trends.

•••
Port Coquitlam Benchmark Price Overview:
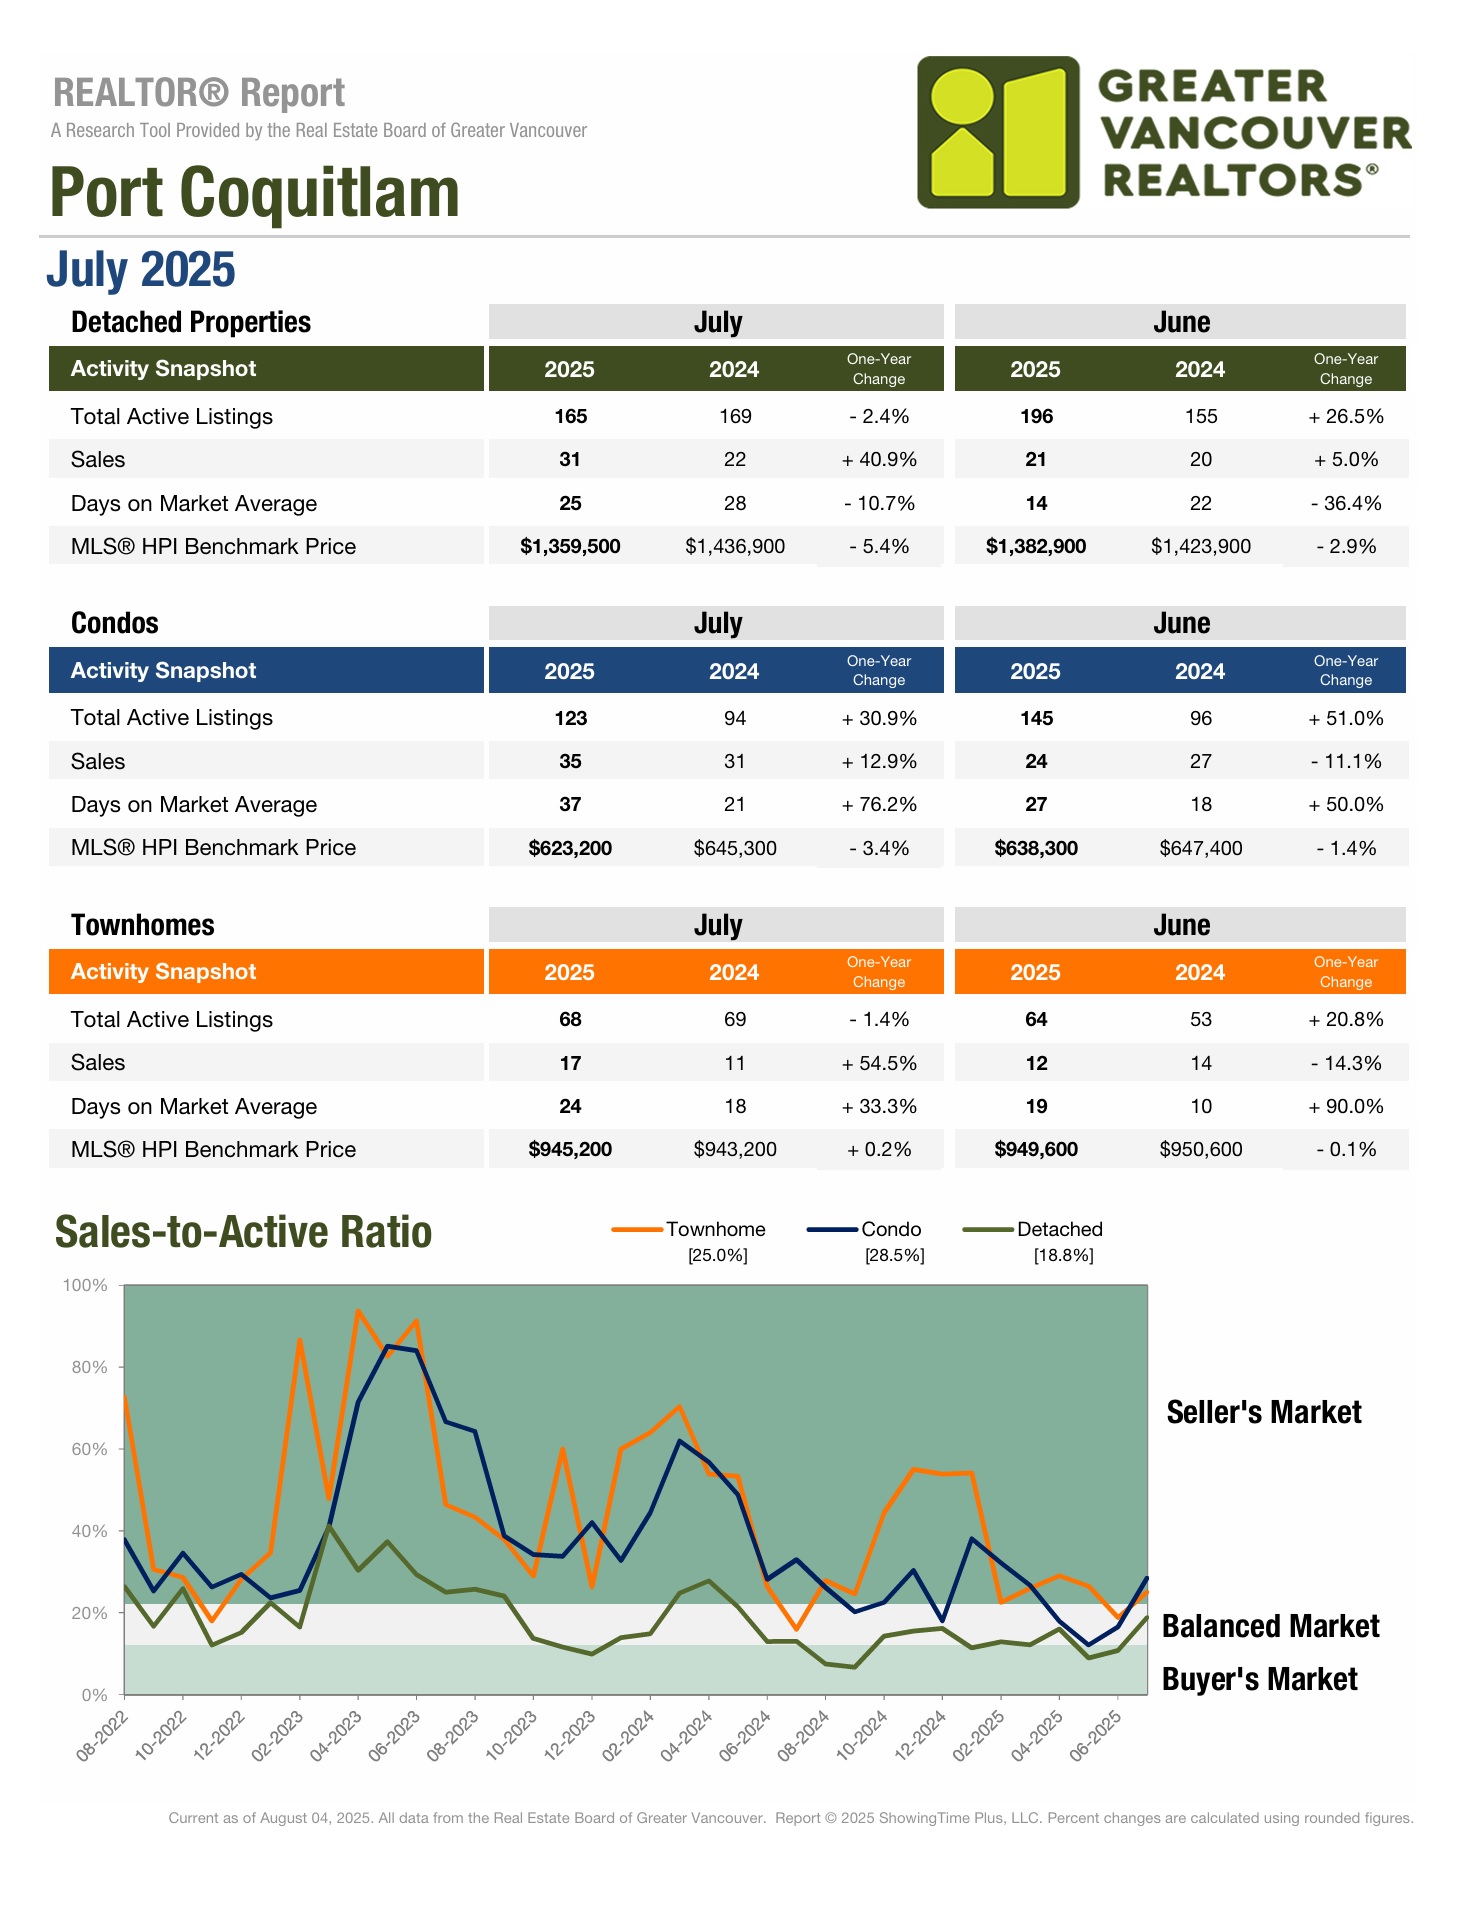
- Townhouse: July is completely the reverse of June...month over month and year over year sales are up for townhouses, supply remains stable, and the benchmark price is down. After increasing $66,000 in 8 months, prices have come down $11,100 since May.
- Detached: After holding within a 19k window for the first five months of the year, 2025's halfway point was marked by a shift downwards. Unfortunately July has kept this trend. Supply has finally begun to come down for detached homes.
- Condo: Since February condos have been within the same 1.4% of price as they were the previous year...but that all changed in July. Prices dipped.
- The 2025 benchmark high was $645,400 back in January. July's benchmark is now $22,200 below the high.
- The July drop more than doubles the benchmark fluctuation seen anywhere in the first 6 months of the year.
- It also means for the first time in roughly a year and the half the benchmark has fluctuated more than $20,000. Calling in to question the condo markets role as the most stable element of Poco real estate.
- Real change may be coming to the condo market for the first time in a few years.
Port Coquitlam Market Snapshot (a review):
- Over the last six months the real estate market in Poco has developed as follows:
- February saw a big jump in townhouse pricing, supply still well below Oct/Nov 2024 levels, large days on market decrease, & relatively low-but steady-sales.
- The main change in March was supply, it increased across the board. Month-over-month sales saw a small increase...year over year sales are 26-36% down.
- In April supply continued to rise, sales volume remained low, and 2/3 of the market held pricing whie detached homes dipped for the second consecutive month.
- After two months of minor pricing decreases May brought an increase to the detached market and condo dipped. Supply remains high, but the rate of increase has decreased. Number of sales dipped for both detached homes and condos while it held for townhouses.
- The big story for June is the detached market’s benchmark price decrease; it was large and out of character for the year. The second shift would be narrowing supply & strengthening sales. Supply is still overblown compared to 2024 and sales are still minorly below the previous year. But June marks the first true month of correction in 2025. Buyers are assisting the market tighten.
- July was busy. All three segments of the market experienced year-over-year and month-over-month sales increases. 2/3 of the market have returned to 2024 levels of supply...and all of this activity has come at the expense of a benchmark pricing decrease accross the board.
Year-over-year Comparison:
- After five months of slow yo-yo style recovery for the detached market June and July flipped the tables.
- The 60-day decline between May & July is now very similar what was experienced between October & November last year.
- The recovery seen in the first five months of the year has now been completely erased.
- For the third month in a row the 2025 benchmark has dipped below what it was in 2024.The last time detached homes dipped below the previous year's benchmark was June 2023.
- The big question is now...was June-July or a correction? Or is the market truely headed downward?
- How the townhouse market has evolved since dipping under $900,000 in October 2024?
- January of this year was the townhouse markets only true substantial down month.
- After jumping up in February, March-May all saw the benchmark price inch upwards.
- The benchmark saw a small dip in both June and July, but it still sits above 6 months of benchmark pricing over the last year.
- Currently the benchmark is $11,100 below the 2025 peak & just $7,500 below the 2024 peak.
- After peaking in February 2024 the condo market has really levelled off.
- Feb 2024 the benchmark price was $650,200.
- Until this July the low point, over the last 17 months, was November 2024. July 2025 is the new low.
- July's benchmark was $3,800 lower than Nov 2024.
- This is the first time in over a year and a half that the condo market has experienced any real concrete pricing change in a 30 day window.
- May marked the first time in 2025 that the benchmark had decreased for two consecutive months, but it has rebounded in June.
- For the second month in a row active listings are down and sales are up. A strong indicator that the market is tightening. But the increase in activity is coming at the expense of sales prices.
- Will sales now continue at a higher rate while prices hold? Or will they decrease further in order to generate more deals?
Overall Supply & Sales Update:
Compared to the same time supply is low in 2/3 of the market:
- Detached: -2.4%
- Condo: +30.9%
- Townhouse: -1.4%
....July was the first month in 2025 to see supply dip below the previous year.
When July supply is compared to June:
- Detached: 31 less listings than in June
- Condo: 22 less listings than in June
- Townhouse: 4 more listings than in June
Compared to the same time last year sales have seen a strong increase:
- Detached: +40.9%
- Condo: +12.9%
- Townhomes: -54.5%
...this is a drastic change compared to the rest of the year.
Sales are up month over month (compared to June):
- Detached: 10 more sales than June
- Condo: 9 more sales than June
- Townhouse: 5 more sales than June

•••
Detached Market Update:
- July 2025 vs 2024 sees the detached benchmark price decrease by $77,400.
- After starting out 2025 with three strong months the detched market stumbled for two months before its worst performance of the year two months in a row.
- Since the 2025 peak in February the benchmark price has declined $61,000.
- In 30 days it saw a $23,400 decline.
- In 60 days it saw a $52,500 decline.
- From January to May the benchmark was sable only fluctuating within a $19,000 window, but now the benchmark price is the lowest it has been since April 2023.
- The worst benchmark performance in 27 months.
- Until June the majority of the detached markets perceived issues stemmed from a rough finish to 2024.
- Jan - May simply didn't rebound as quickly as is traditional. But during that time supply built up.
- July have brought supply back to the levels we saw between Jan and April when the market was rebounding from 2024...but it has done so at the cost of the benchmark price.
Detached Home Benchmark Pricing:
- August: $1,432,100
- September: $1,419,100
- October: $1,456,900
- November: $1,392,700
- December: $1,379,500
- January 2025: $1,401,100
- February: $1,420,500
- March: $1,418,500
- April: $1,408,900
- May: $1,412,000
- June: $1,382,900
- July: $1,359,500
•••
Townhouse Market Update:
- October 2024 was the low point for the townhouse market. The benchmark price had dropped $69,800 in just 60 days.
- The benchmark price rebounded quickly before dipping in January.
- Five of the last seven months the townhouse market has been rock solid with the benchmark fluctuating by $6,700 at most.
- After both April & May saw new benchmark peaks for 2025, June & July both dipped...but only slghtly.
- The benchmark price has still climbed $62,300 since October 2024.
- Despite this segments strength six of the last ten months have seen the benchmark price below the previous year.
- In May it was 0.9% below the previous year.
- In June it was just 0.1% below.
- Now in July it is 0.2% above the previous year.
- The townhouse market is now, by far, the strongest segment within Port Coquitlam.
Townhouse Benchmark Pricing:
- August:$952,700
- September: $900,200
- October: $882,900
- November: $936,600
- December:$940,700
- January: $924,200
- February: $950,000
- March: $950,700
- April: $955,400
- May: $956,300
- June: $949,600
- July: $945,200

Summary:
Port Coquitlam’s real estate market in July 2025 saw rising activity but falling prices, a sharp shift after months of steadiness. All three segments—detached, townhouses, and condos—posted month-over-month and year-over-year sales growth, but at the expense of benchmark pricing, which declined across the board. Supply has also tightened for two-thirds of the market, dipping below 2024 levels for the first time this year.
Detached homes remain the most volatile. After stability in early 2025, the segment has now recorded two sharp declines. July’s benchmark fell another $23,400, pushing values $61,000 below the February peak and to their lowest since April 2023—erasing the recovery of the year’s first five months.
Townhouses, the strongest segment, have softened slightly. July’s $11,100 dip from the peak is modest, and values remain above much of 2024, climbing $62,300 since October’s low. Stability, steady sales, and balanced supply continue to define the segment.
Condos delivered the biggest surprise. For the first time in over 18 months, the benchmark shifted meaningfully, falling $22,200 from January’s high. It’s the sharpest decline since late 2023, raising questions about whether the most stable class is entering a period of change.
Overall, July underscored a paradox: demand is rising across every segment, but prices are slipping as the market recalibrates. The next few months will reveal whether this is a brief correction or the start of a deeper adjustment.
Our Google reviews will give you all the confidence you need!
TOP 5 reasons to work with R3 Hayes Real Estate Group

In a market full of noise and hesitation, we’re the steady hand you can trust.
Whether you're planning ahead or ready to make a move, let's talk strategy—we’re here to help you come out ahead.

R3 Hayes Real Estate Group – Your Neighbourhood Experts
Call/Text Ryan: 604-561-2127
Follow us on social media for more market updates!
