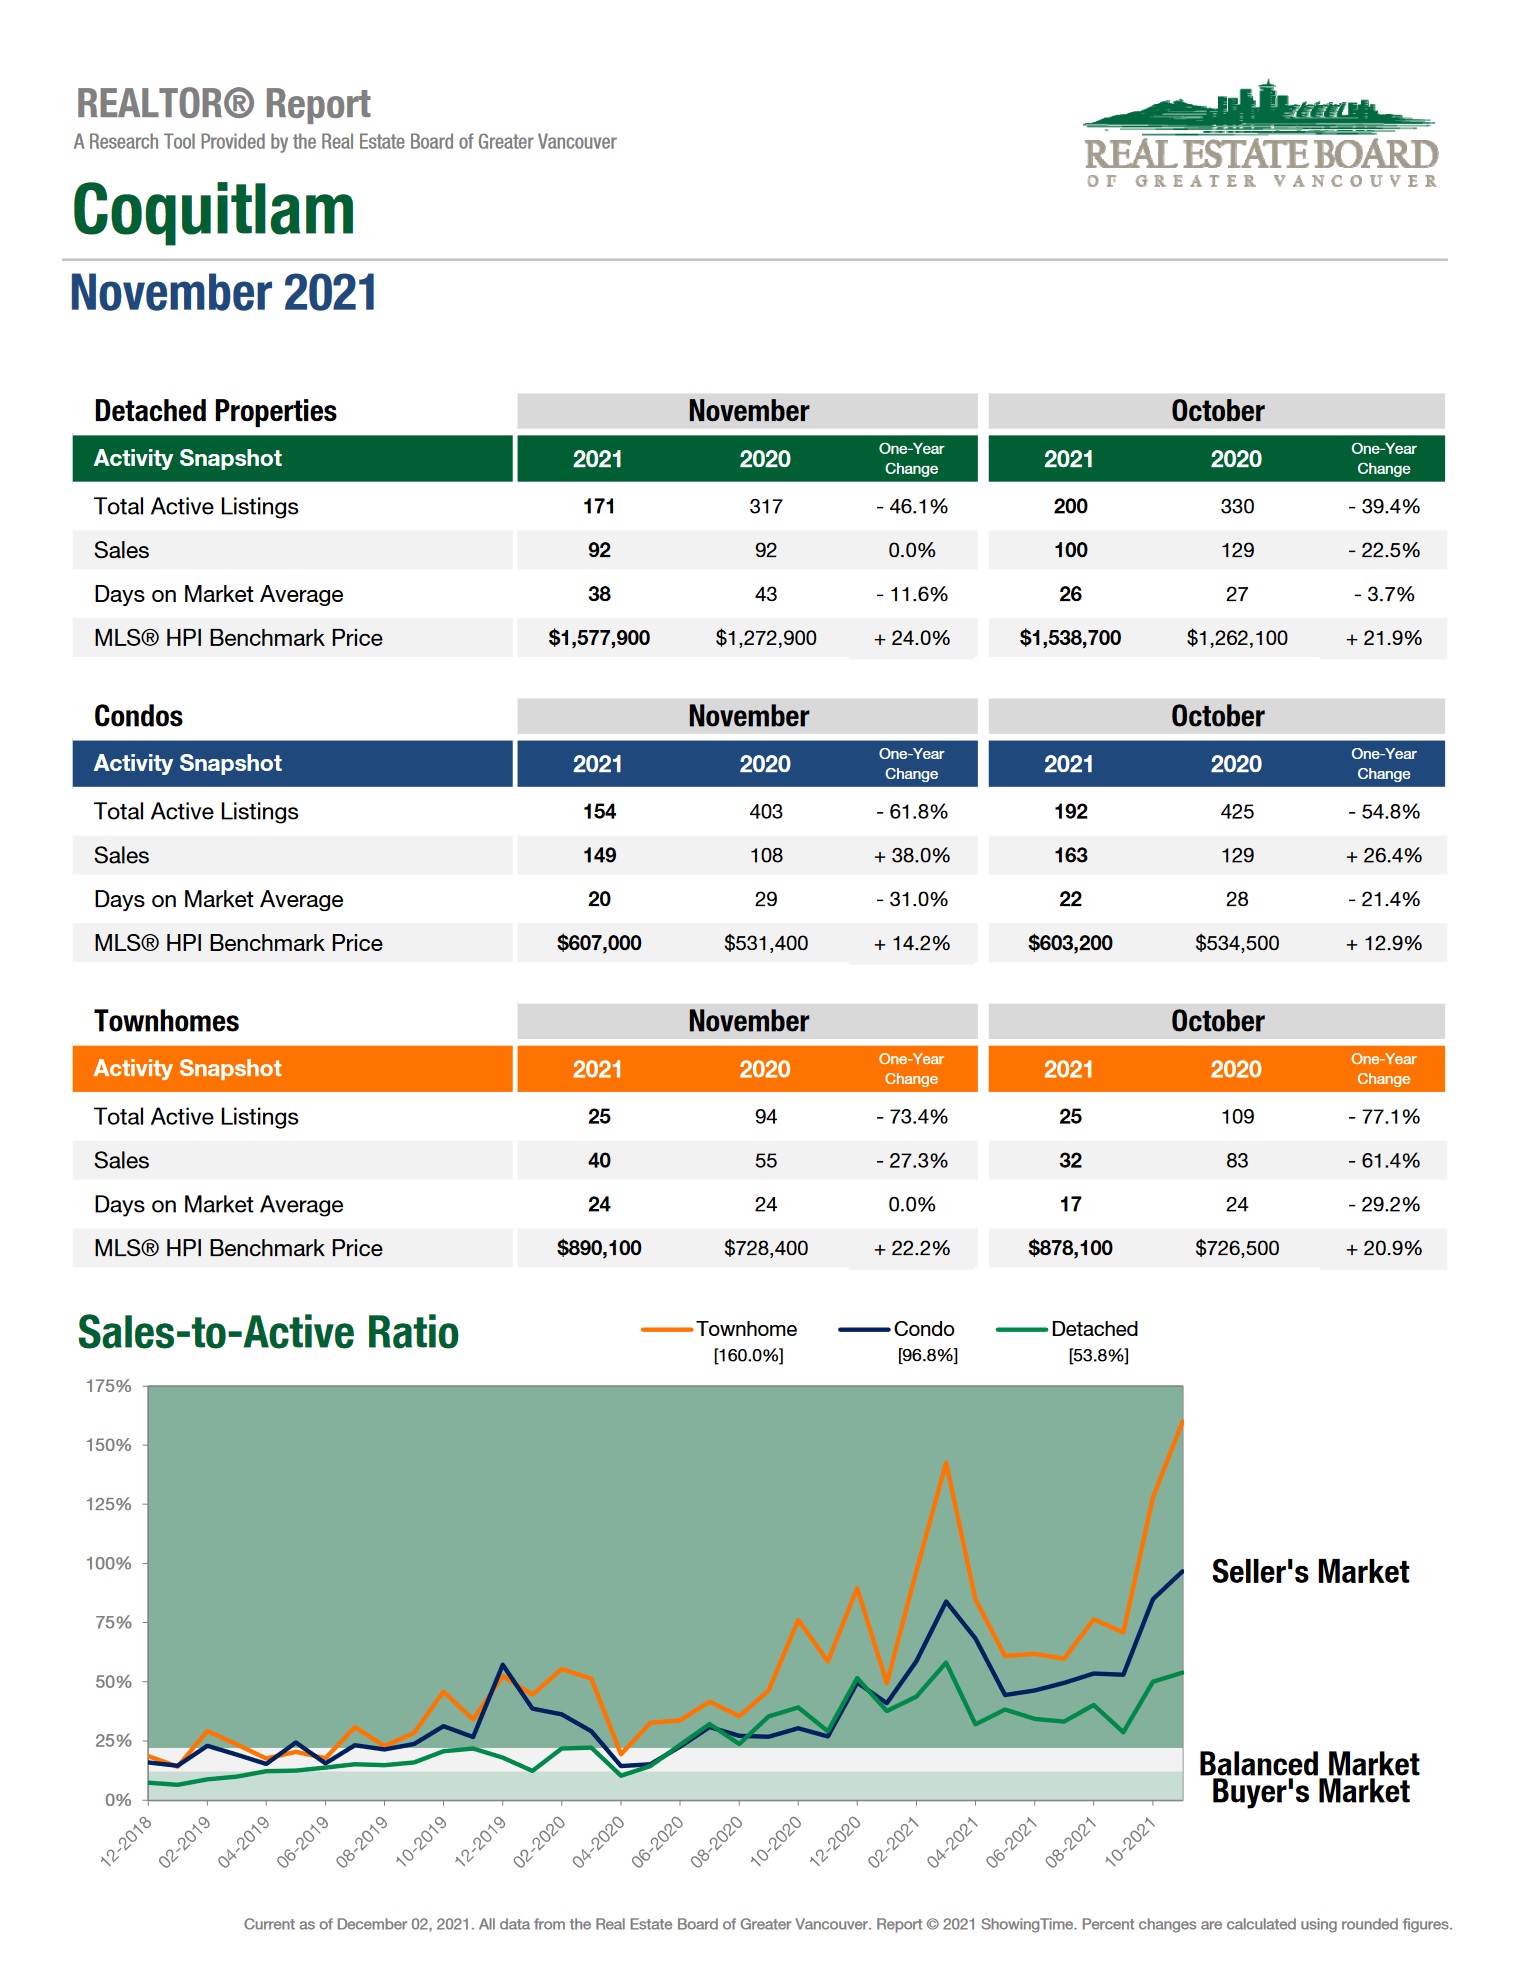
Benchmark prices are up across the board, between 14.2-24% over thier 2020 counterparts.
After breaking the $1,500,000 mark in June detached homes began to slow their rapid price increase.
However, along with the rest of the Tri City area, October and November have seen a return to large monthly pricing increases.
Ocotber saw largest 30 day increase in 6 months, and November nearly doubles October's 30 day increase.

October saw a $22,500 increase over September's benchmark prices.
November saw $39,200 increase over October's Benchmark prices.
This amounts to a $61,700 increase in just 60 days.

November marks the 17th consecutive month over month increase for detached home pricing.

May: $1,499,100
June: $1,501,800
July: $1,505,400
August: $1,508,600
September: $1,516,200
October: $1,538,700
November: $1,577,900

November 2021 prices are $305,000 higher than November 2020.
September was a slow month in terms of supply accross the board.
 The entire market saw a large decrease in supply compared to the same period in 2020: 46.1-73.4%
Stock is also down compared to October 2021, marking this the third consecutive month of steadly lowering supply:
 Detached: -14.5%
Condo: -19.8%
Townhouse: 0%
Townhouse benchmark prices may not be increasing as rapidly as detached homes, but prices have been slowly creeping up since their May 2021 price jump:

April: $786,700
May: $833,900
June: $843,200
July: $847,300
August: $848,900
September: $863,600
October: $878,100
November: $890,100

Townhouse benchmark pricing is $161,700 higher than the same time in 2020.
Townhouse prices have now increased for 15 consecutive months.